Utilization of Data science and Machine Learning in the retail industry by Ananya Misra
Introduction
Hello everyone! My name is Anania. Today, I'll be discussing the impact and application of data science in the retail industry. I am a data scientist at Seven Learning, a Berlin-based company specializing in using cutting-edge machine learning to help retailers optimize prices.
Why Concentrate on Retail Industry?
Data science has a significant influence on a wide range of industries. In sales and marketing, we notice an increase in the revenue growth from AI-based use cases in marketing, sales, product and service development, and supply chain management. Most noteworthy is the effect in sales and pricing prediction, likelihood to buy forecasting, and customer service analytics.
Data Science Applications in Retail
- Price Optimization: Using data science, we can answer questions like how retailers can set their prices to increase revenue while keeping customers happy.
- Personalized Marketing: It allows retailers to use knowledge of the items a customer likes and dislikes to attract them with potential interesting offers.
- Fraud Detection: Helps in identifying and mitigating potential frauds.
- Augmented Reality: Recent tech advancements like AR are being used by stores like IKEA to virtually showcase their products in customer's living spaces.
- Customer Sentiment Analysis: Analysing customer data can give us insights into how the customer feels about a product or service.
- Recommendation Systems: These systems recommend new products based on your potential purchasing behavior.
Types of Retail Data
We can gather various types of data in retail. This can be sales data, consumer data, or inventory data. Sales data could include price, quantity, and items sold. Consumer data could include behavioral data, click-through rates, items brought and sold. Real-time inventory data is available in stores and warehouses thanks to sensor technology.
The Role of Machine Learning in Retail: XGBoost Example
One popular machine learning algorithm, XGBoost, excels in sales prediction and can be optimized by incorporating the errors of the previous models. This iterative "boosting" process relies on combining several simple models to create a more robust learner.
XGBoost works by connecting various weak learners, individual decision trees in this instance, to create one strong learned model. Each tree tries to reduce the error of the previous tree. The new learner fits the errors, or the residuals, of the previous step, improving the model sequentially.
Hyperparameters of XGBoost
The four main hyperparameters of XGBoost are learning rate, max steps, alpha, and the number of estimators. These control and adjust the weighting of the estimators, prevent overfitting, and specify the model's build.
Advantages of XGBoost
- Parallel Processing: XGBoost utilizes the power of parallel processing using multiple CPU cores.
- Regularization: Uses different regularization penalties to avoid overfitting.
- Nonlinear Data Patterns: Can detect and learn from nonlinear data patterns
- Cross-Validation: For unbiased training and evaluation, XGBoost allows the user to run cross-validation at each iteration of the boosting process.
Conclusion
In summary, retail industry trends show the growing incorporation of data science and machine learning models in decision-making processes. With the ability to generate more accurate predictions, improve inventory management, and provide personalized customer experiences, these contributions can be pivotal in determining a retailer's success.
Questions and Discussion
Feel free to connect me on LinkedIn if you have any questions or if you're interested in opportunities at Seven Learning. We're always looking to expand our team with talented individuals passionate about data science in retail.
Video Transcription
Hello, everyone. Uh My name is Anania and today I'll be presenting utilization of data science in the retail industry. A little bit about myself.I work as a data scientist in seven learnings and seven learning specializes um in helping retailers to optimize the prices using advanced machine learning models. Um Currently, we're based in Berlin and before um I've worked as a in the areas of software development, web analysis project and program management. So why this topic? Um This slide shows the effect of decreasing costs and increasing revenue in the different industries. Correspondent report revenue growth from A I use cases in marketing and sales, product and service development and supply chain management. The most impact has been seen in the marketing and the sales industry in sales and marketing correspondence. Most often report increases from using A I in pricing prediction of likelihood to buy and customer service analytics in product and service development. Um We use uh new A I BASED products and new A I enhancements in supply chain management. Um Respondents often cite sales and demand forecasting and spin analytics as use cases that generate revenue. In short, the use of A I helps the industries positively. So where can we use data science uh in retail, we could use it for price optimization.
This could answer the question of how do retailers set the prices? So they increase revenue but also make the customers happy, personalized marketing. How to use the knowledge of the items with likes and dislikes to attract the customers with potential interesting offers, fraud detection, augmented reality.
As we can see from the picture on the right that um it is recently used by IKEA to showcase the products from their stores virtually into the customer's living space. Customer sentiment analysis. Um tells us how to analyze information of the customer to get some insights and finally recommendation system which recommends new products based on your possible chasing behavior. What kind of data we can get from the retail, we can get the sales data that could this could be anything from the price quantity and the item sold or we can get um consumer data to be specific maybe behavioral data that gets uh the click through rate items brought and sold inventory data um in stores and warehouses.
And it could also come from the sensor data to detect the location of products. The velocity of this data could anywhere range from a monthly basis to an hourly basis. What are the possible research questions we could ask? We could ask um how can we combine sales with consumer data to improve our forecast or how we can improve trust by using granular data from different sources. Using the consumer data, we can use, how can we use eye tracking and emotion to to stock the shelves or how can we incorporate information about tweets likes into our forecast to get better predictions using the location. How can we use the sensor data to improve inventory management?
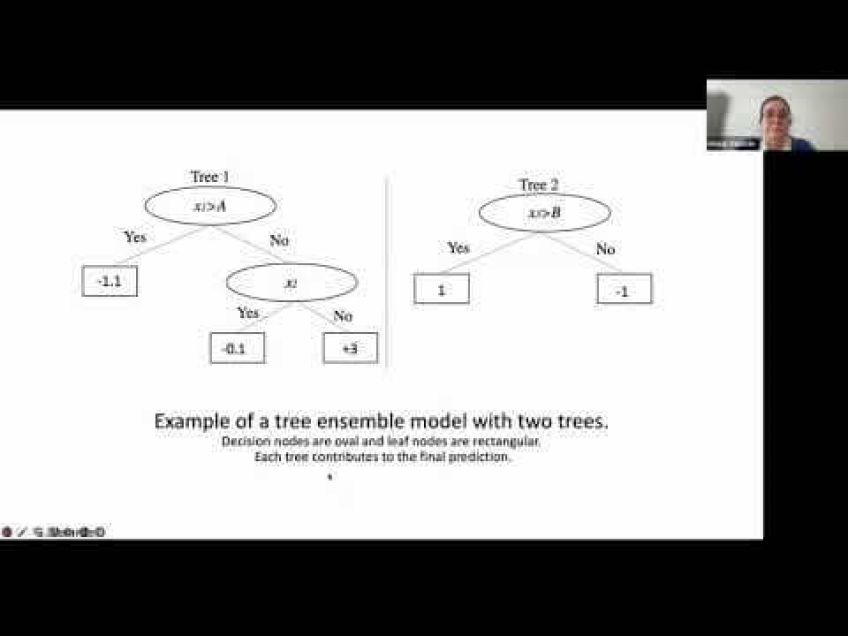
And how can we also make purchasing decisions based on the location of the customers? One of the most popular ML algorithms is XG boost and that can be used in sales prediction. And that's what you are talking about today. Since XG boost is built on a combination of concepts, we will take each of these concepts step by step. The first concepts are trees, supervised learning algorithm in each leaf node present a decision and the branches present a choice between the number of alternatives. These functions are evaluated by a series of if or L statement. And as a tree, we usually start at the start of the root and we work our way through the branches depending on the values. And finally ending about the trees, the leaves here is an example of a train model for the survival rate on Titanic. By following the branches of the tree, we can come to the conclusion of the survival rate to evaluate this tree. We can follow the sequence of hanel statement. For example, if you're a male and an adult, then your survival rate is as low as 20%. This is how three models perform predictions in a nutshell boosting. Now that we have trained our three models, we can improve it iteratively by incorporating the errors of the previous models. We would like to combine these simple models to get a strong learner.
Imagine we plot our data set into two D grid where some target values are classified as positive and some are negative. We would like to obtain a classifier that can distinguish between these two classes. Every false positive is given more weights. So the next learner can learn from the past mistakes. In D one, the blue area depicts the prediction of the model and we can see that the plus are classified correctly. However, we do miss out on some of the pluses in the red region. So the plus predictions in the red region are penalized more. Hence, in iteration two, we classify the pluses correctly that we classified wrongly before. But now we classify the minus as wrong. So we use this process and combine these simple models to get a strong learner. We take the correct classification from each of these small models. And when combined these models give us an accurate classification. So um great in boosting decision trees, this is when we combine many weak learners to come up with one strong learner and the weak learners here are the individual decision trees. All trees are connected in series and each tree tries to minimize the error of the previous tree.
The weak learners are fit in such a way that the new learner fits the errors or the residuals of the previous step. So the model improves the final model aggregates the result of each step. And thus a strong learner is achieved. We use a loss function to use um to detect the residuals or the errors. Here is a pictorial representation on how FG boost works. In this case, tree two learns on the mistakes of tree one and penalizes the wrong classification. R one R two are the errors. And the alpha specifies how much to penalize these residuals. And eventually we combine all the weak learners to get a strong learner in the final model. What are the hyper parameter of HT boost? We have four main hyper parameter which are learning rate. Max steps alpha and a number of estimators learning rate is used to control and adjust the weighting of the estimators. And the learning rate should be a small value to force long term learning. The max depth decides the depth degree of the estimators which are trees in this case. And we make slips up to the max step specified and we prune the trees towards backwards and remove the splits beyond which there is no positive gain. We manipulate this parameter carefully because it will cause the model to over ft in certain scenarios. Alpha is a special type of regularization parameter.
In this case, L one which helps to avoid overfitting the number of estimators the model model is built upon is um is usually specified by us as well. Here is an example of um attribution implementation. Given an ex um given five years of item store sales data, uh we asked to predict 12 months of sales for a store. In this case, we see the date store item and sales column and we would like to pretend uh we would like to predict the sales for store one in this case. So what we do is we first month, uh we first get a total monthly sales or for store one. And then we divide our data set into test and train. And finally, we applied the XG boost regress um to get the predictions. Our train set consists of four years of data and the test set includes the last year. The default parameter of learning rate is 0.3. But in this case, we choose to go with 0.2 max depth is um used as a default here which is six and alpha is um zero, which is also a default value in this case. Um And we use the number of estimators to be 100.
Of course, this could vary depending on your project. Um And for the predictions here, we see that we are very close to the original value for the past years. The so the predictions are between the range of 2017 and 2018. What are the advantages of HT boost exus uses utilizes the power of pilot processing. So it uses multiple CPU cores to execute the model to execute the model in the um in the forecast stage. It also uses different regularization penalties to avoid overfitting. Um can detect and learn from nonlinear data patterns as well. And it allows the user to run a cross validation at each iteration of the boosting process in uh cross validation is when we divide our data set into n different subsets and we train on N minus one subset and evaluate on one of the subsets. And this ensures non-biased training and evaluation. Now, we would like to um compare the performance using SK learns, make classification data set. Um We see that the accurate the accuracy of the predictions for both XG boost um and gradient boosting um comes quite close to each other in terms of accuracy.
But when we look at the training time, we see the XG boost uh performs this in very um in just 24 seconds. Whereas when compared to the gradient boosting of 2000 seconds, um we use the make classification data set um which has 1 million random randomly generated data samples in just 20 features. And um this is where we come to the end of our presentation. Um Thank you for listening.
If you have any questions, I'll be happy to answer. Um So we have a question here which asks uh could these models be applied to large scale marketing purchasing as in measuring national boycott? Um I in general XG boost um performs well on uh structured data. So it really depends on the data. If um if you have a structured data, um then we would be able to solve these questions. Um in case of regression or classification, how to choose the optimal hyper parameter to have a performance model. Um I think the first thing to do would be um to randomly choose some of the hyper perimeters to see what works. Um There also have been o other methods such as good search. It does usually take a lot of time. Um But there are also some other hyper perimeter searchers that actually could do this for you. Um We have something called uh Kas Tuner and this usually does help to get the best parameters as well. But usually we start off by trying out some random hyper parameter and see to get a feel of how our data looks like and how the model is initially performing. Are there any more questions then? Thank you for listening and um feel free to connect with me on linkedin. Um And they also check our company and learnings if you're because we are hiring and um yeah, um looking forward to connecting with all of you. Thank you.