
WomenTech Network Research · 200+ sourced findings, US and global
Women in AI Statistics 2026
200+ sourced statistics on where women stand in AI: roles and leadership, chatbot adoption, workplace use, job exposure, education and venture funding.
Also published for the Women AI Builders community at womenaibuilders.org.
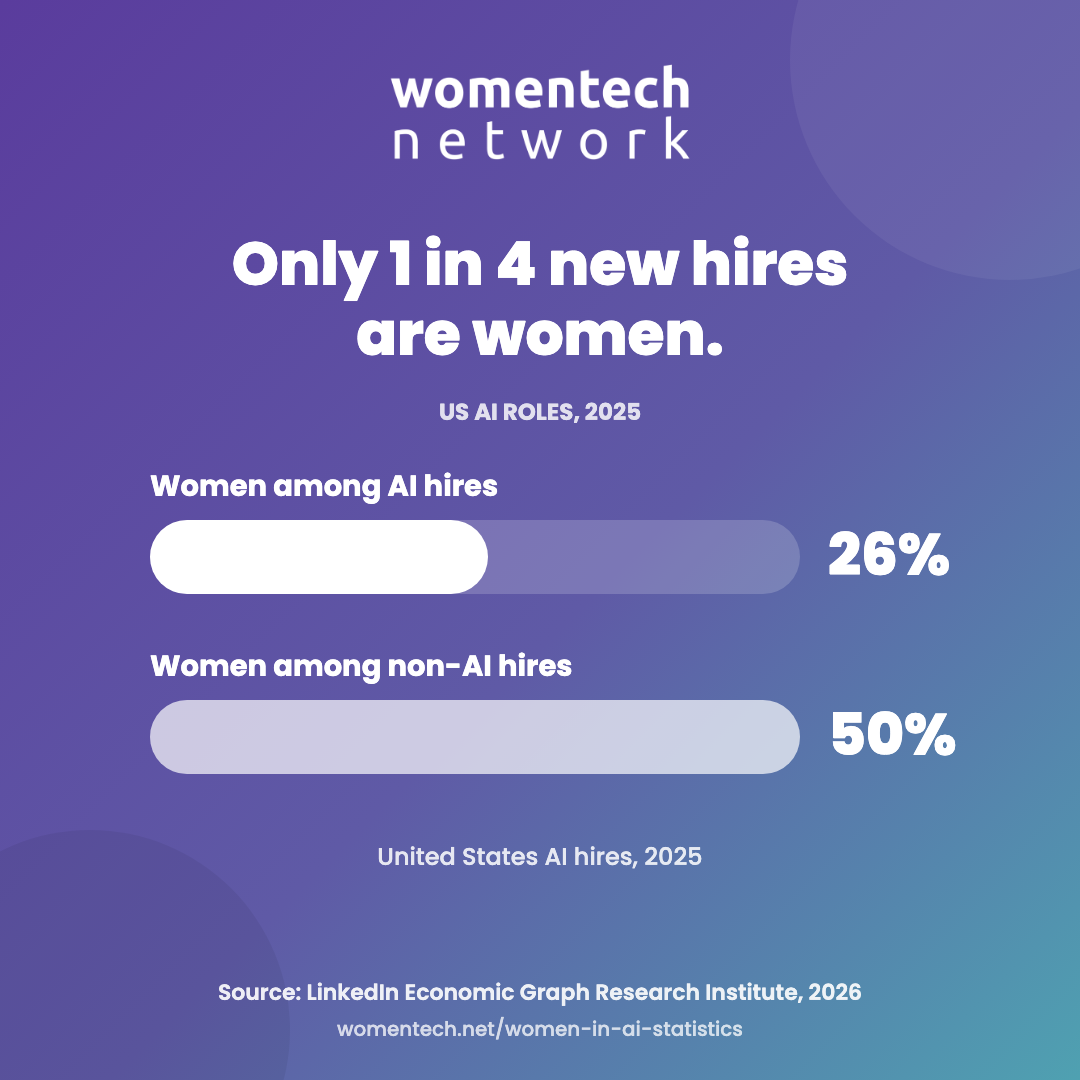
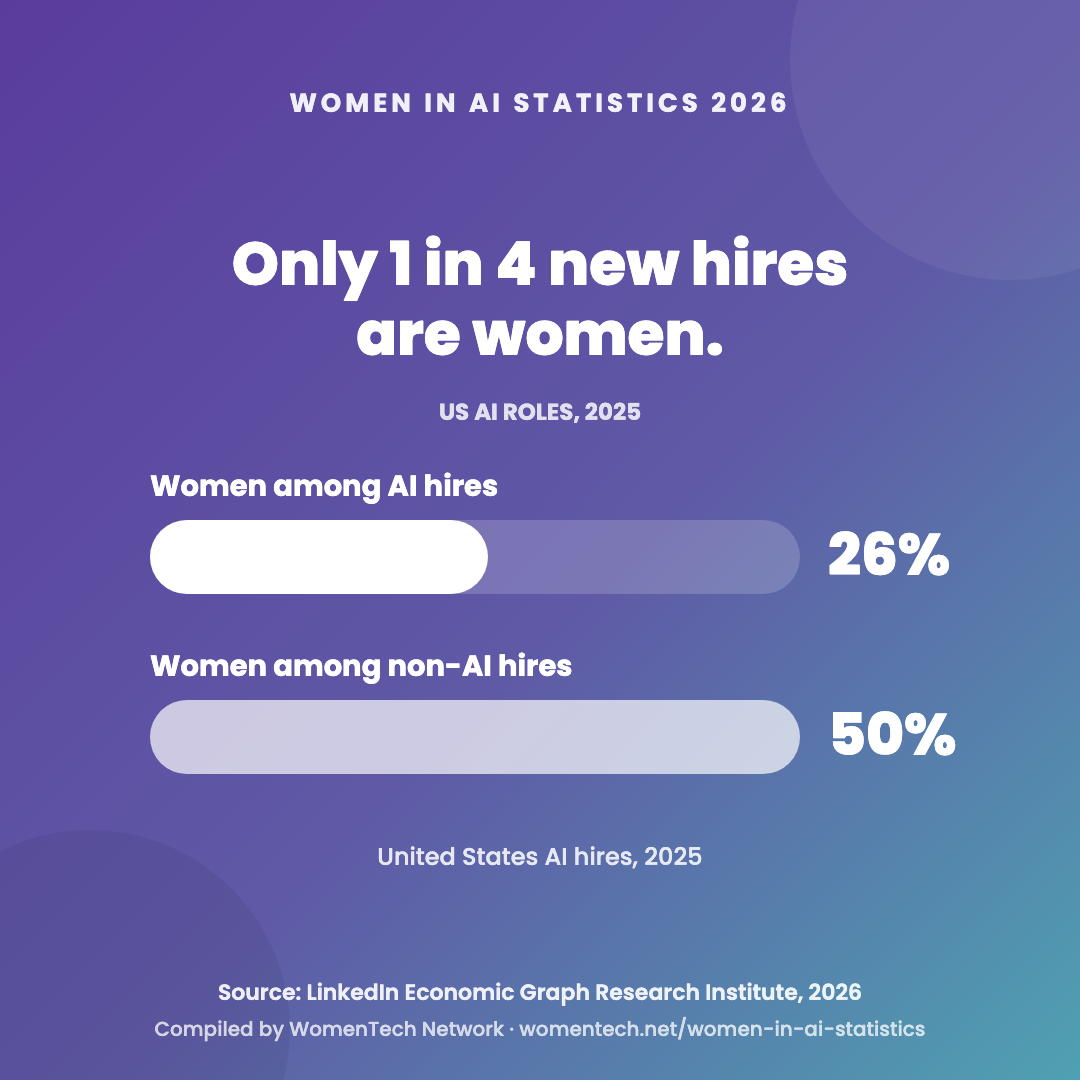
LinkedIn’s Economic Graph Research Institute put women at 26% of US AI hires in 2025, against 50% of hires into non-AI roles: one new AI hire in four.
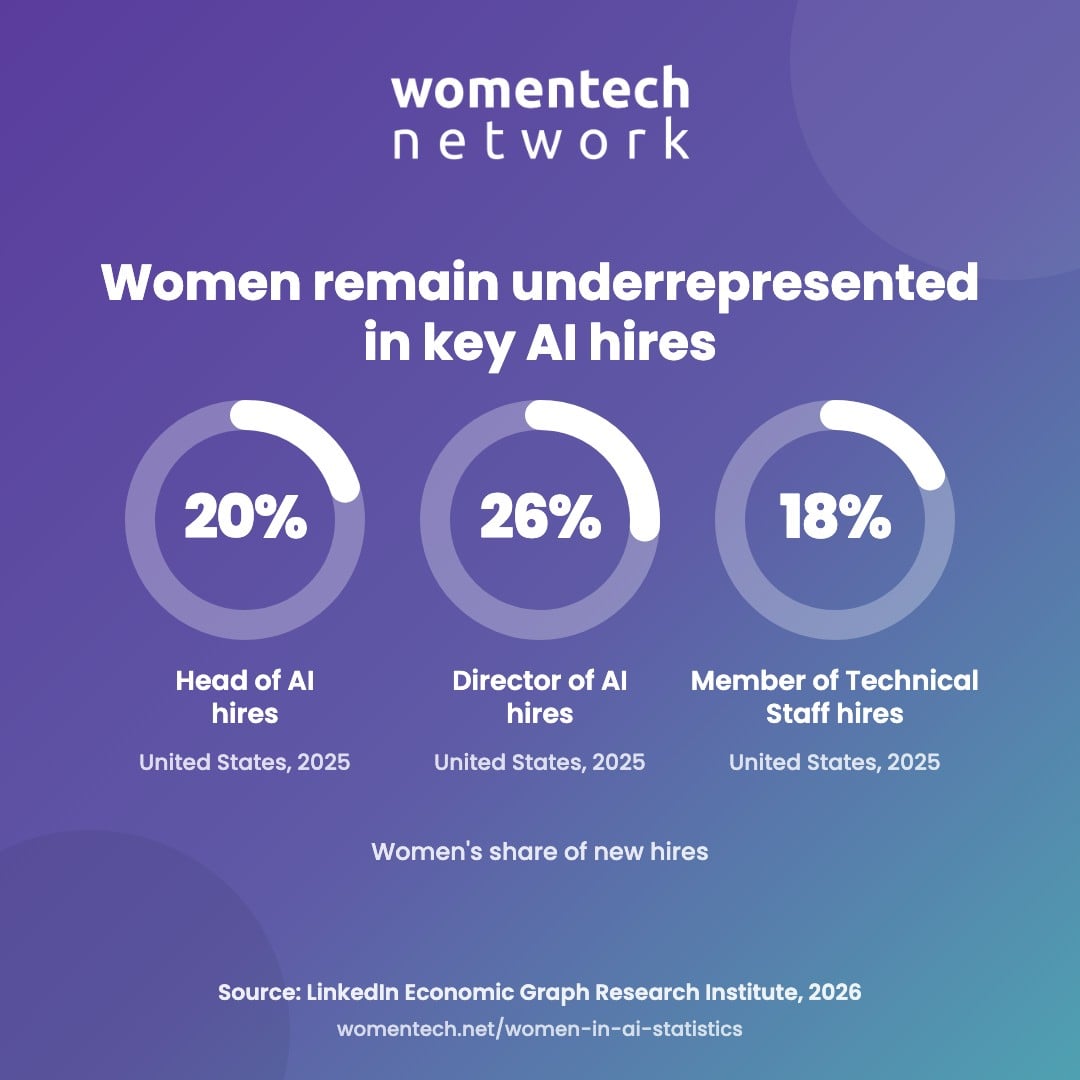
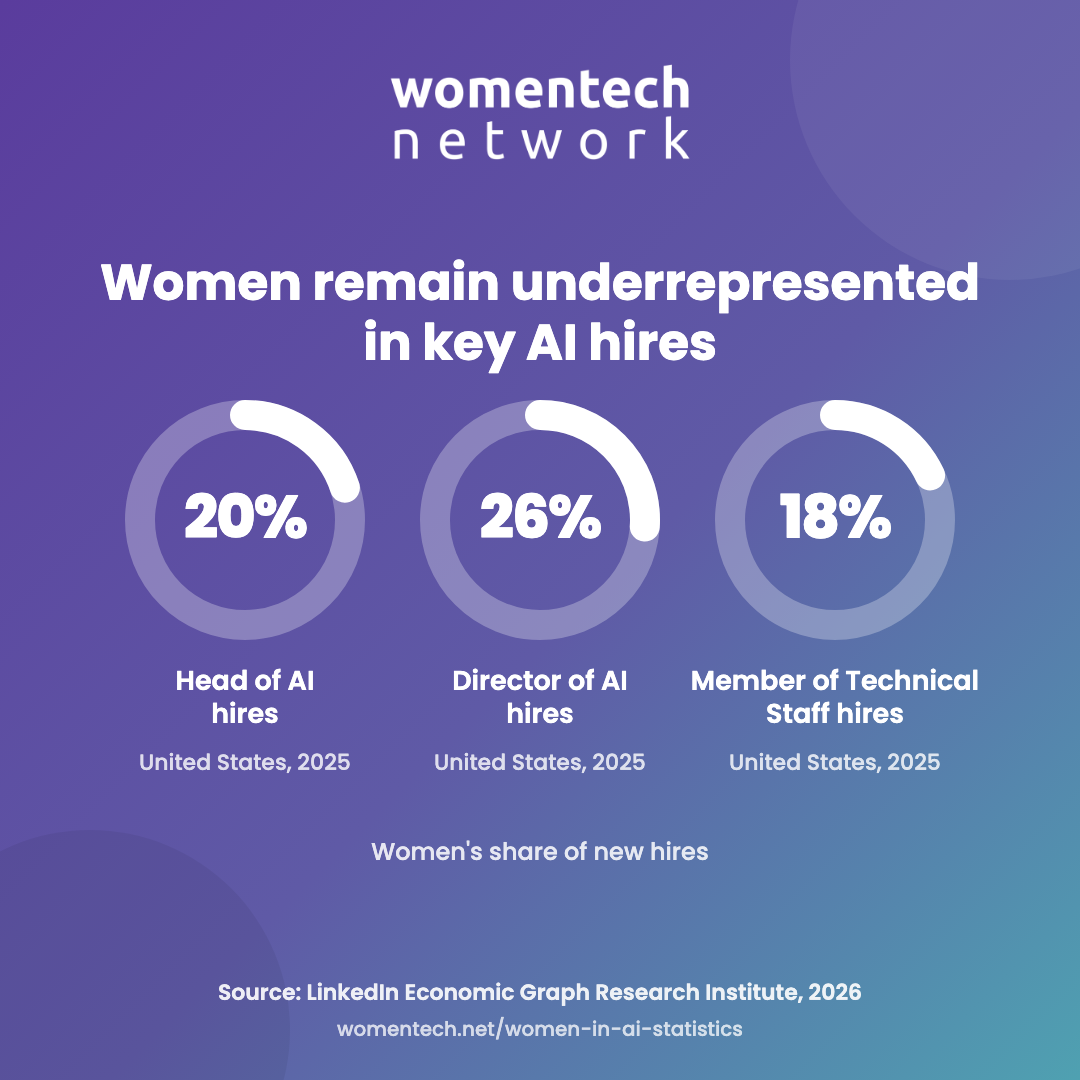
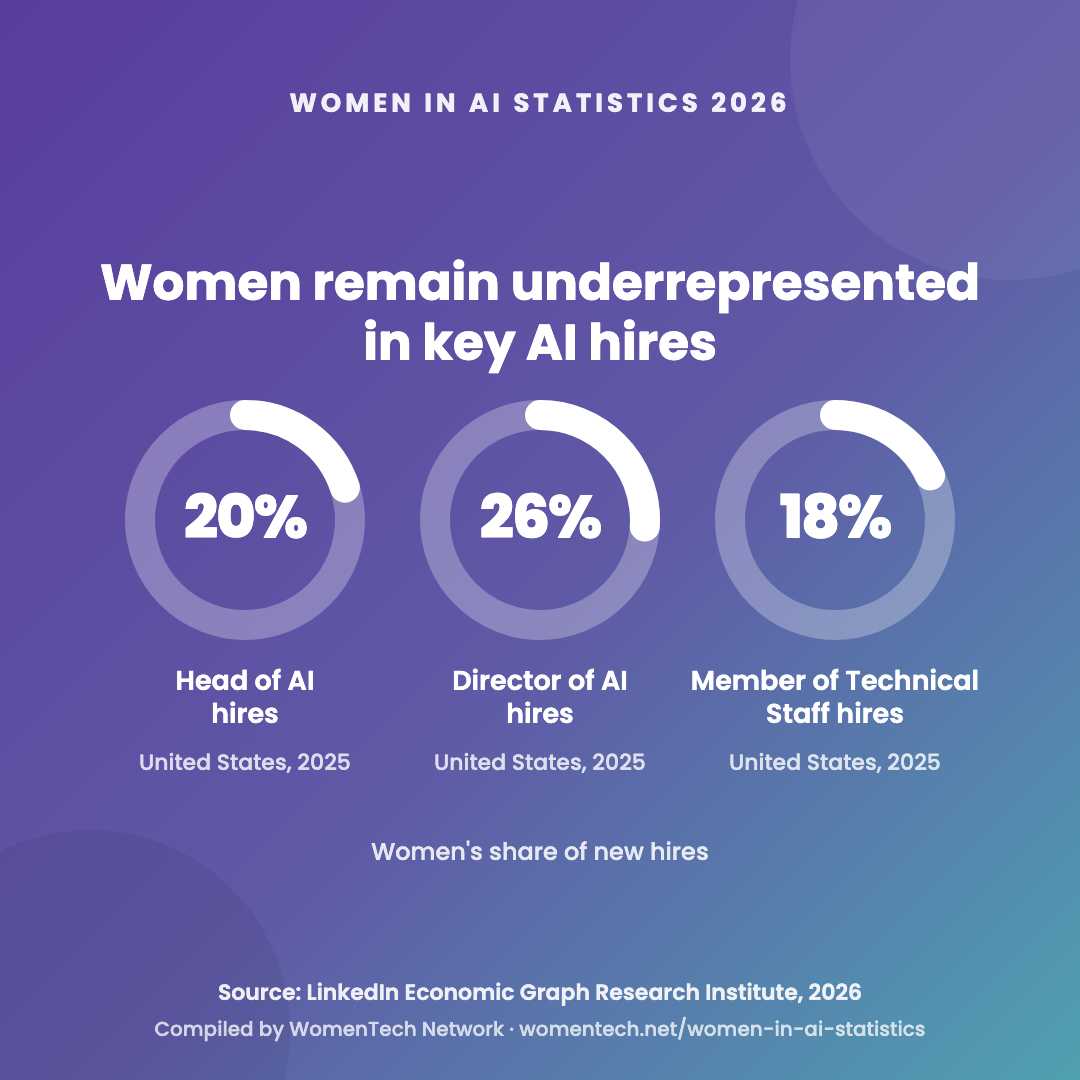
The gap is widest in the roles that carry the most weight. Women were 20% of Head of AI hires, 26% of Director of AI hires and 18% of Member of Technical Staff hires. These are shares of new US hires in 2025, not of everyone currently holding those titles.
The leadership section below follows the same pipeline up to the C-suite, and the table that follows explains how this hires-based measure differs from Stanford’s talent benchmark.

Reading the numbers
Which women-in-AI figure should you quote?
Every headline percentage counts a different population: professionals, talent pools, researchers or executives. The table shows what each one measures before you cite it.
| Figure | What it counts | Scope | Data year | What it shows |
|---|---|---|---|---|
| 26% | Women among new hires into US AI roles | United States | 2025 hires | LinkedIn Economic Graph, August 2026: a flow of new hires, not the current workforce; women were 50% of non-AI hires. |
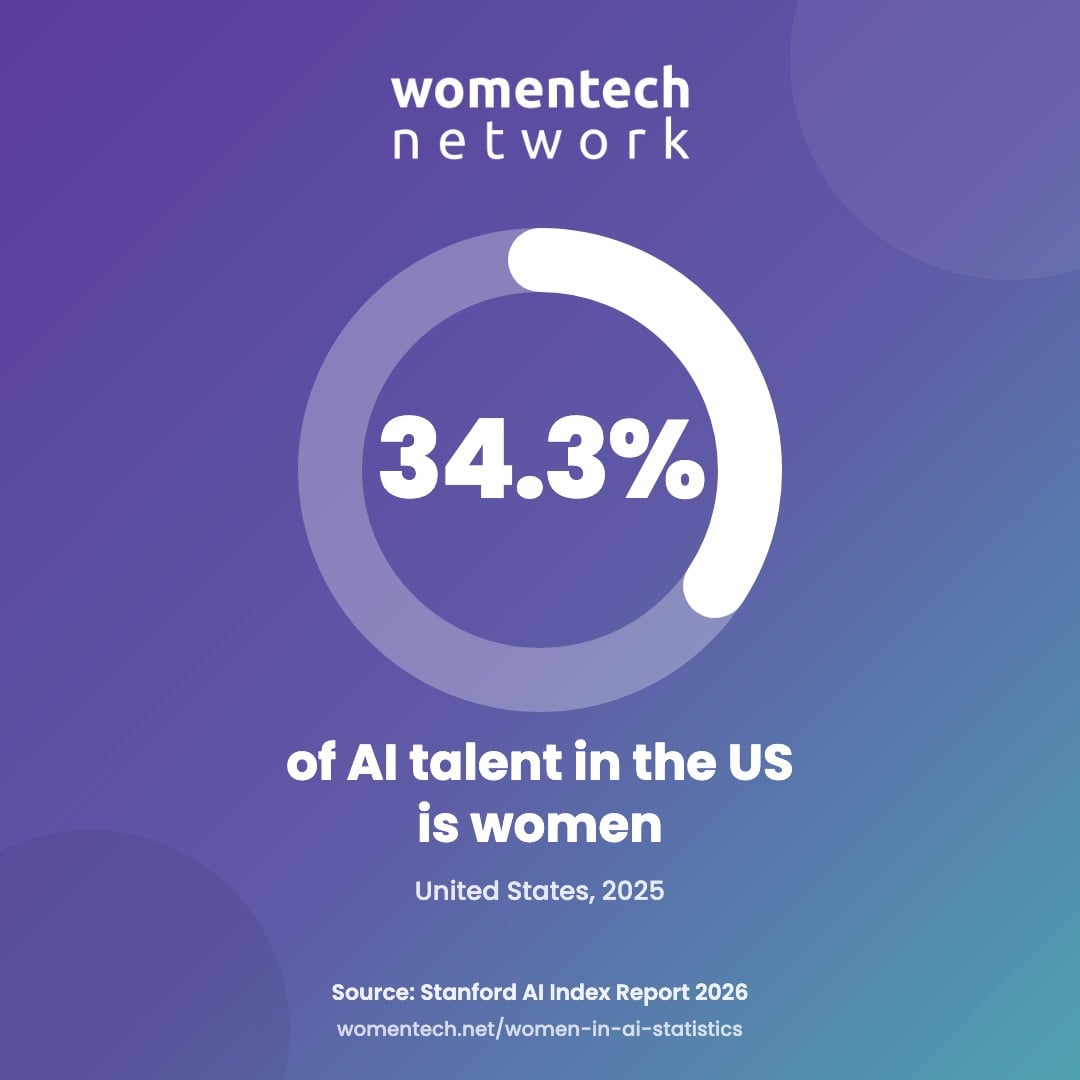
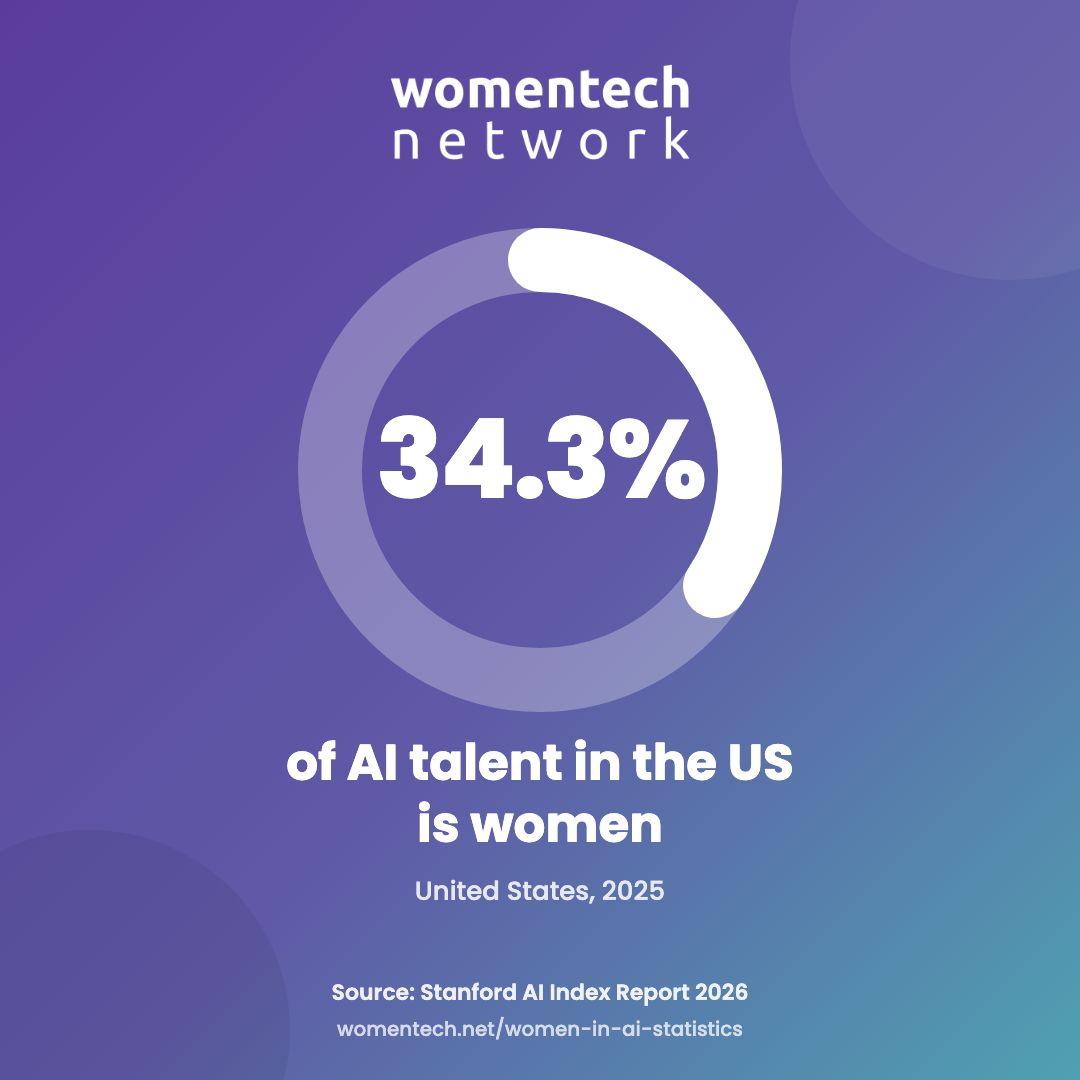
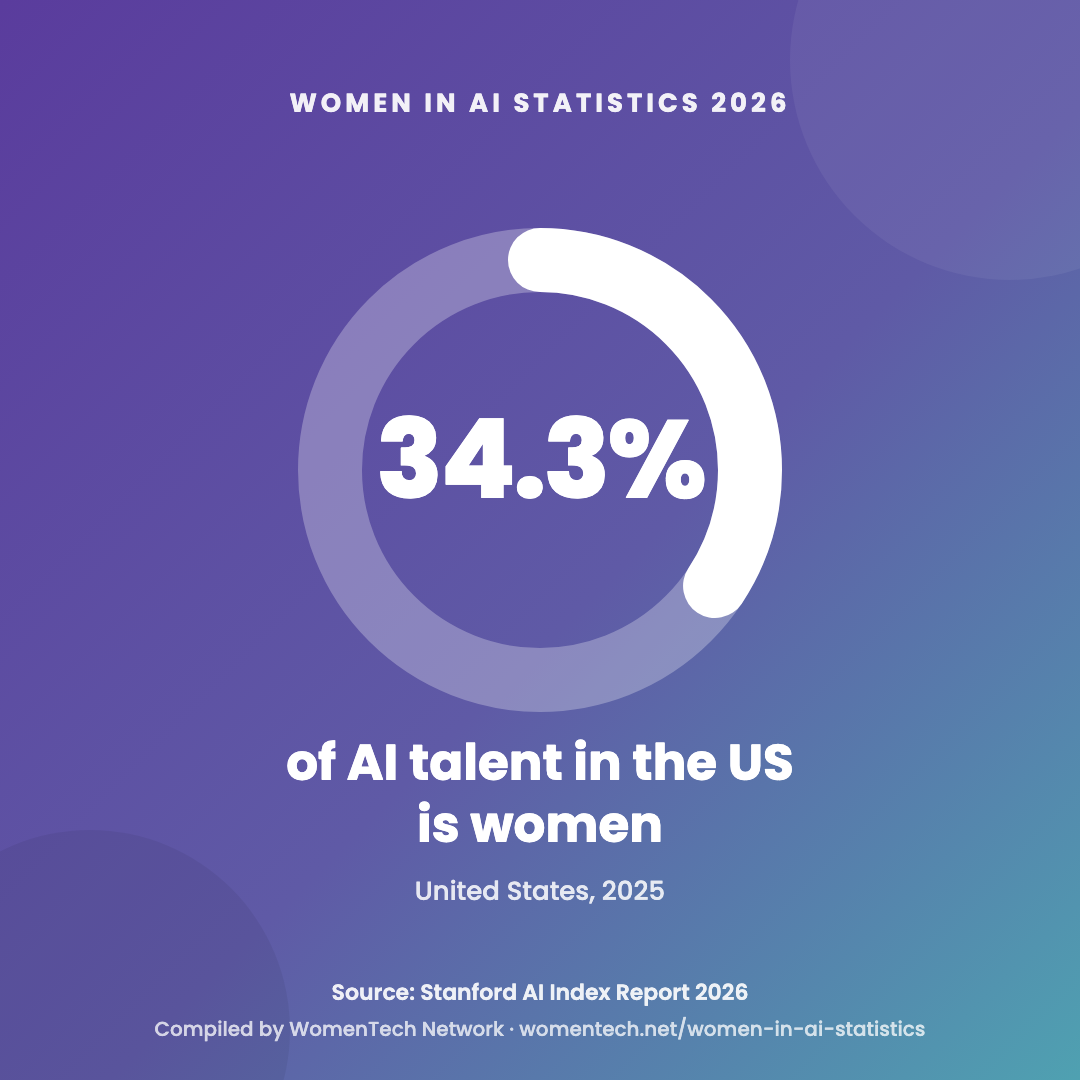
| 34.3% | Women among AI professionals on LinkedIn | United States | 2025 | Latest US country estimate in the Stanford AI Index 2026. |
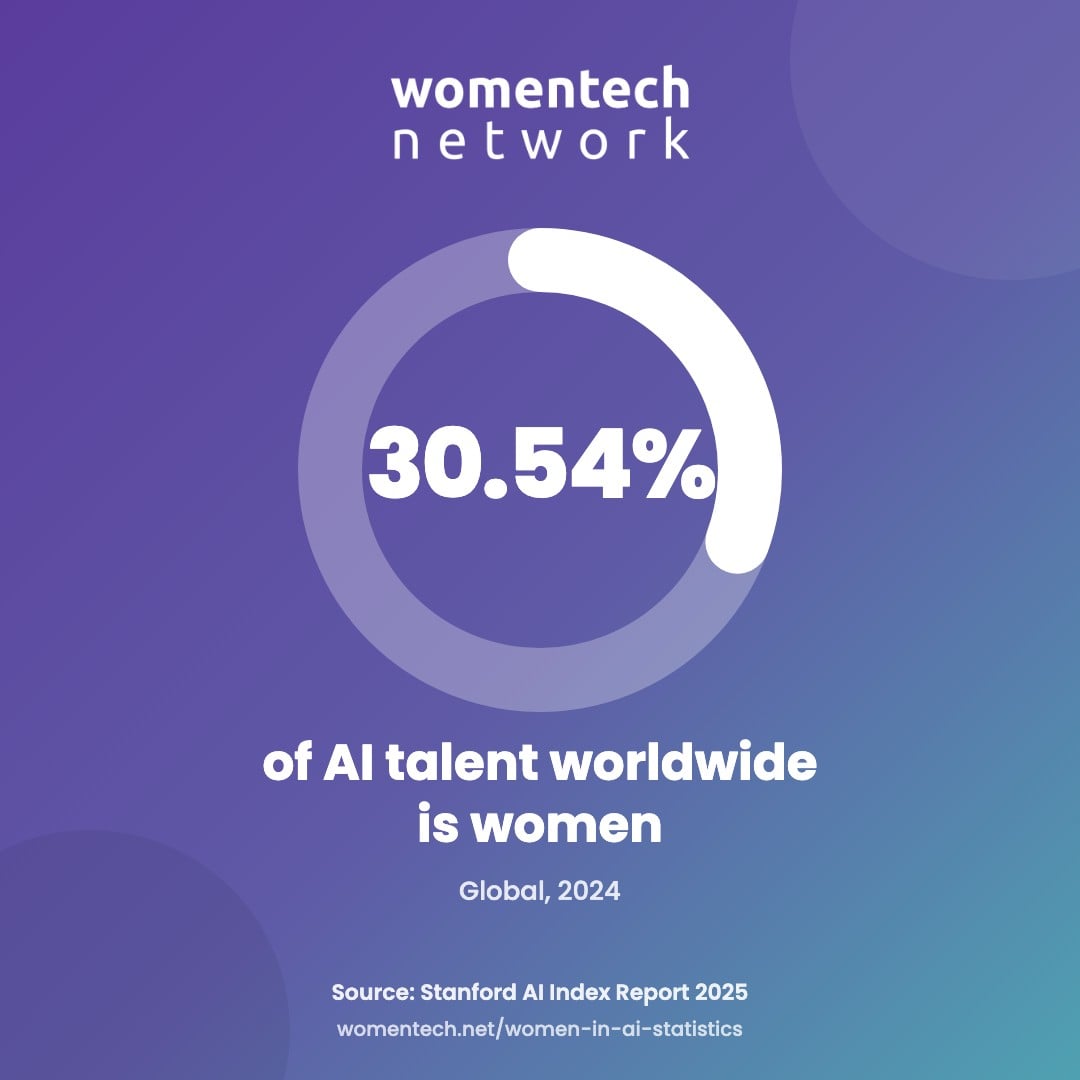
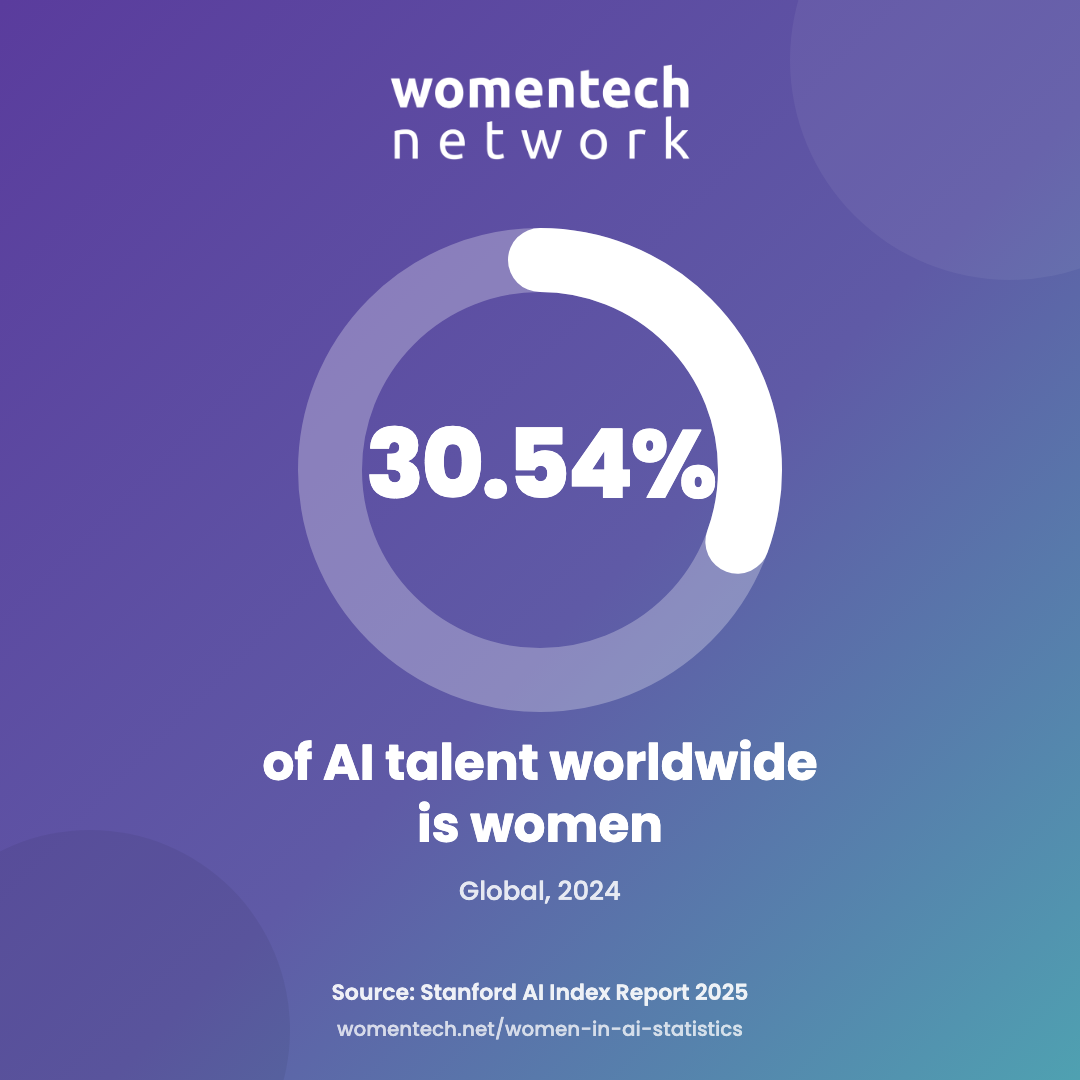
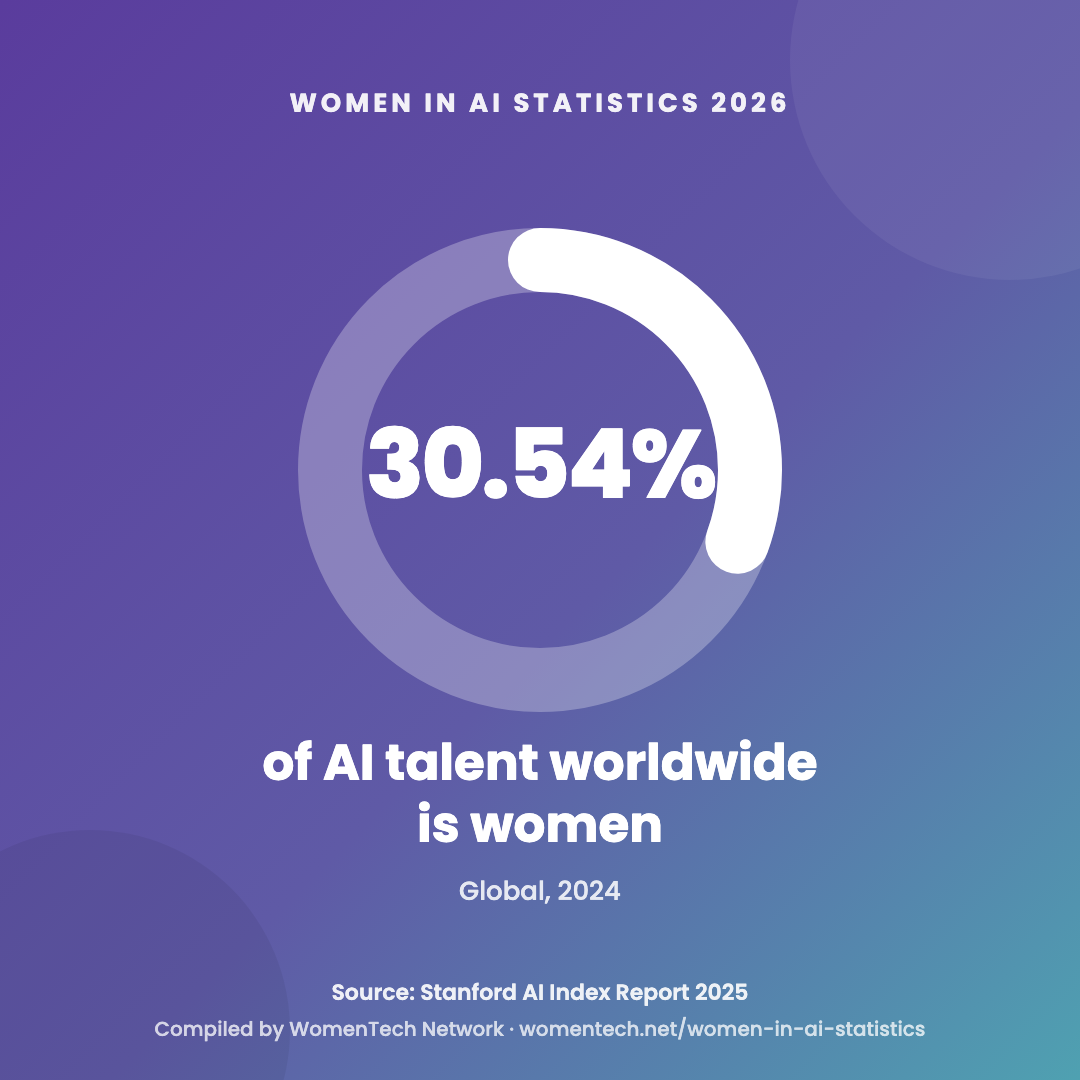
| 30.54% | Women among AI professionals on LinkedIn | Global | 2024 | Women represented nearly one-third of global AI talent. |
| ≈30% | Women in the AI workforce | Global | 2022 | ILO estimate of the whole AI workforce, 2022 data published in 2026: a broader population than the LinkedIn measures above. |
| 22% | LinkedIn members classified as AI professionals | Global | 2018 | Historical WEF benchmark for AI professional roles. |
| 35% | Skills-and-occupation model of the AI workforce | Selected OECD countries | 2018–2020 | Cross-country workforce representation based on skills and occupations. |
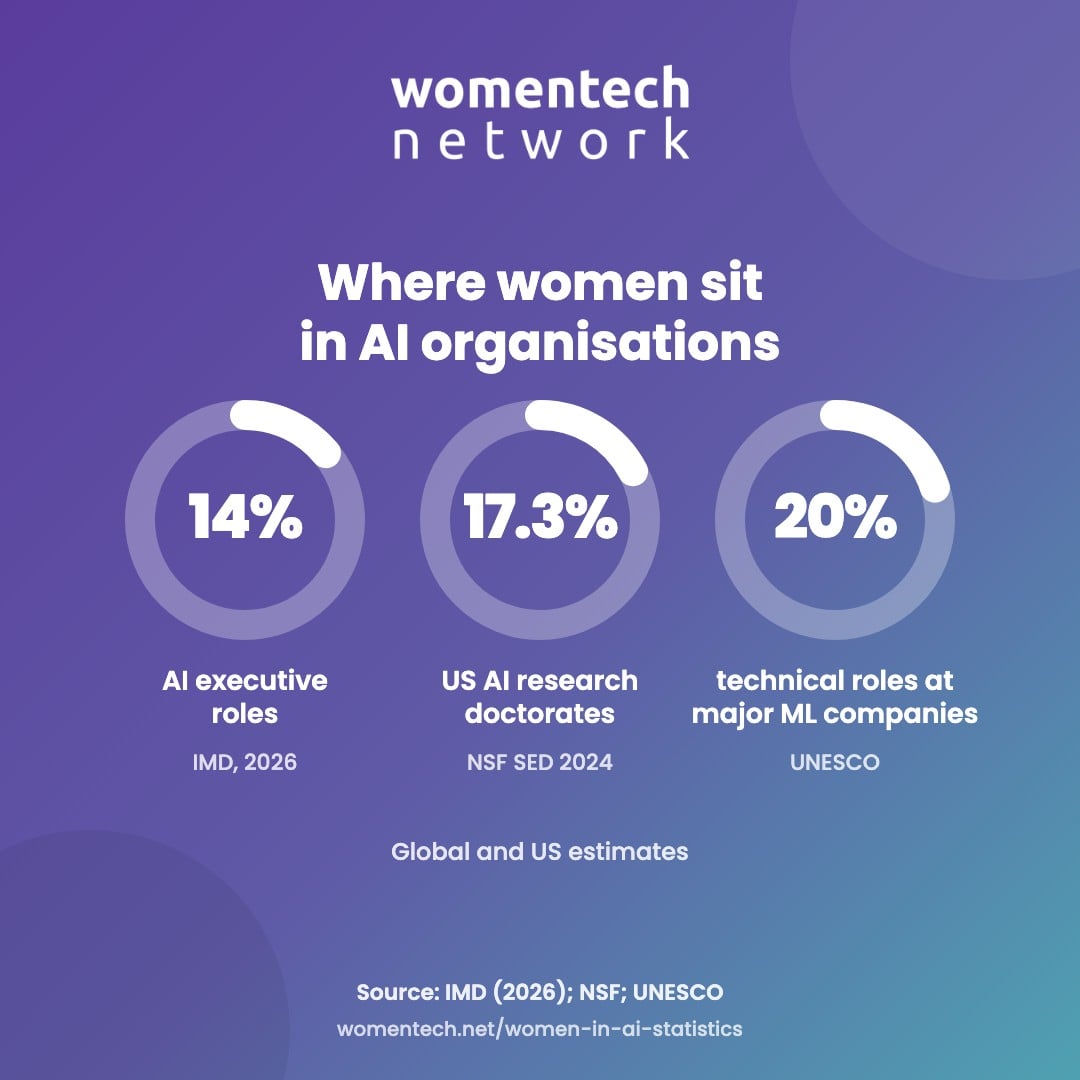
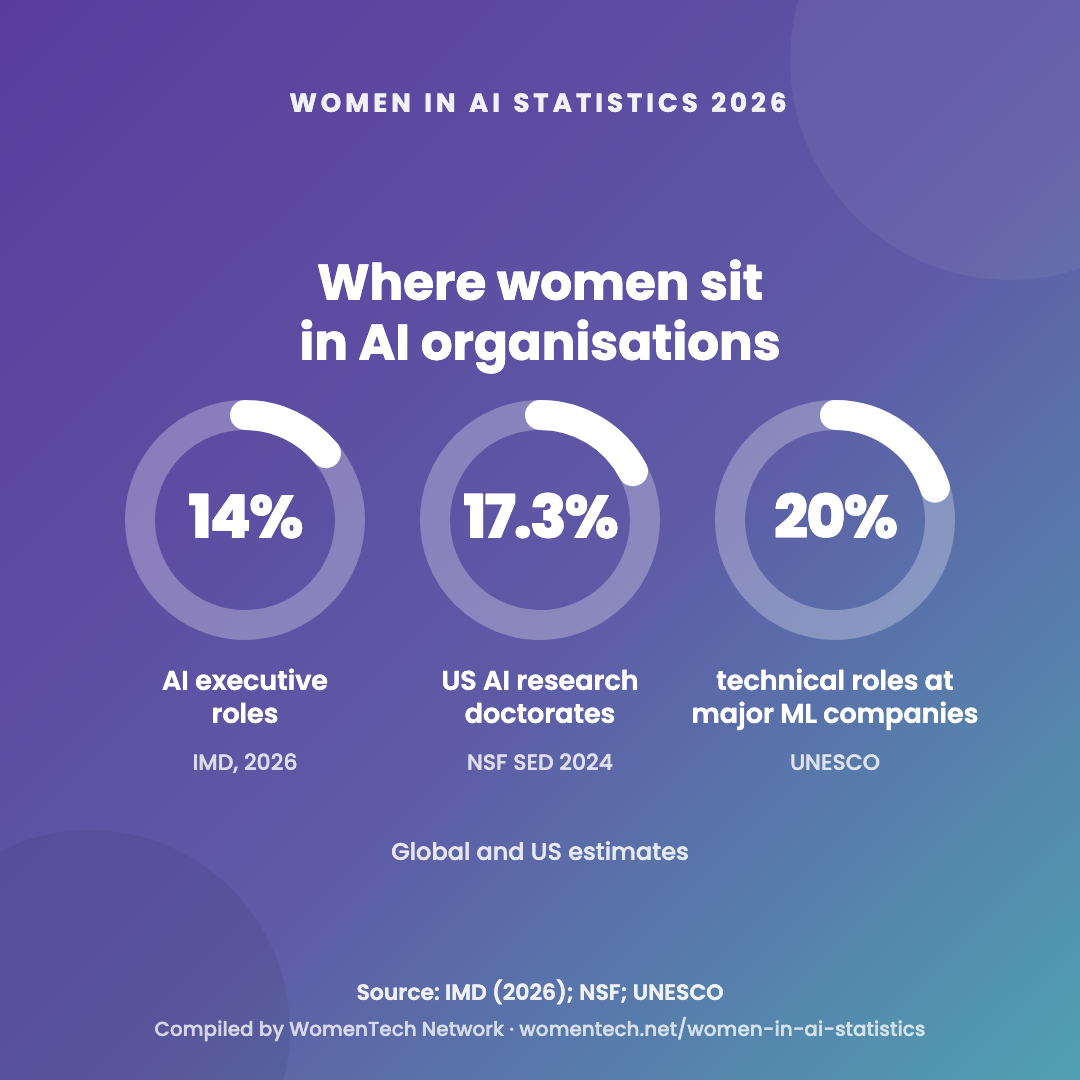
| 20% | Technical employees at major ML companies | Global | Multiple years | Women hold one in five technical roles at major ML companies. |
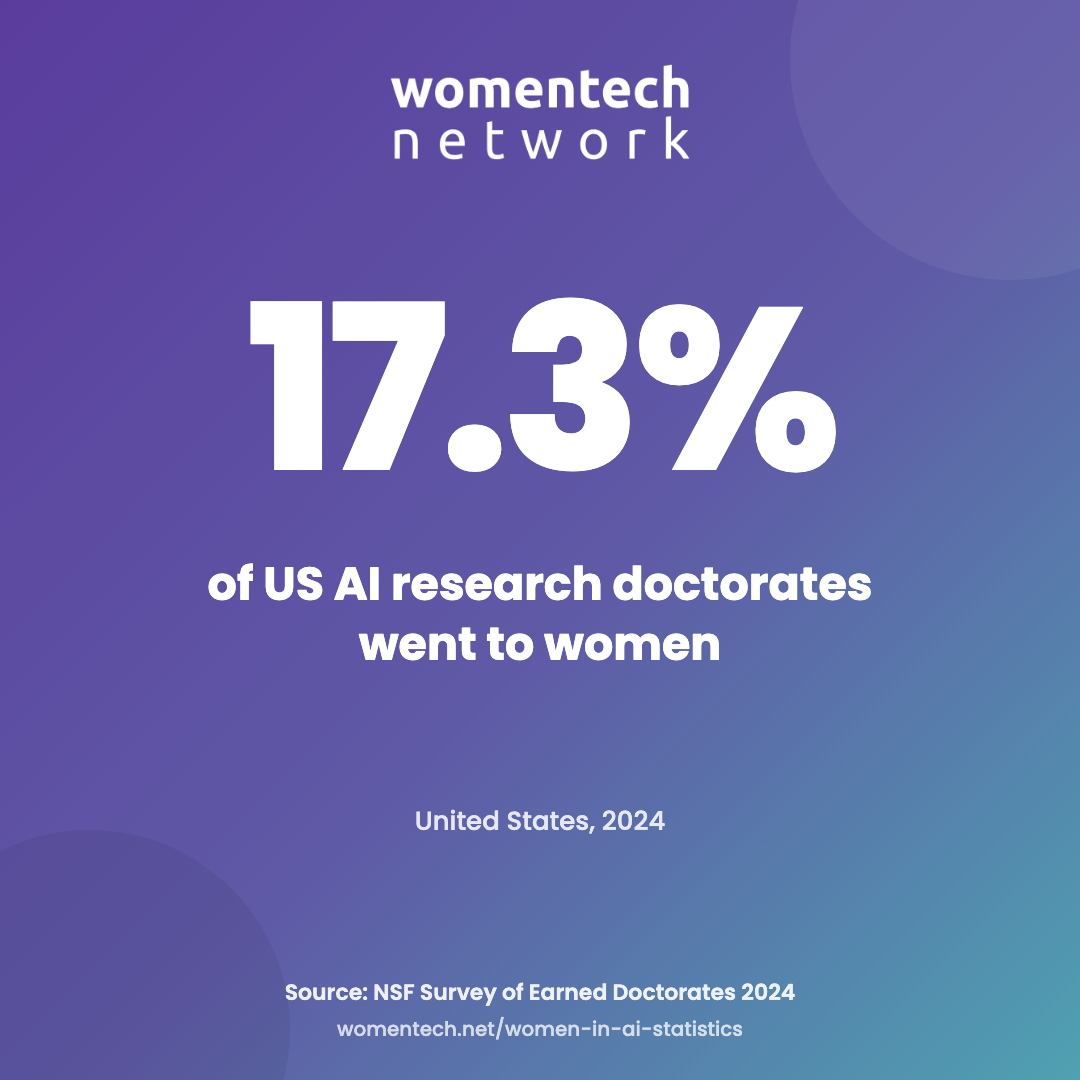
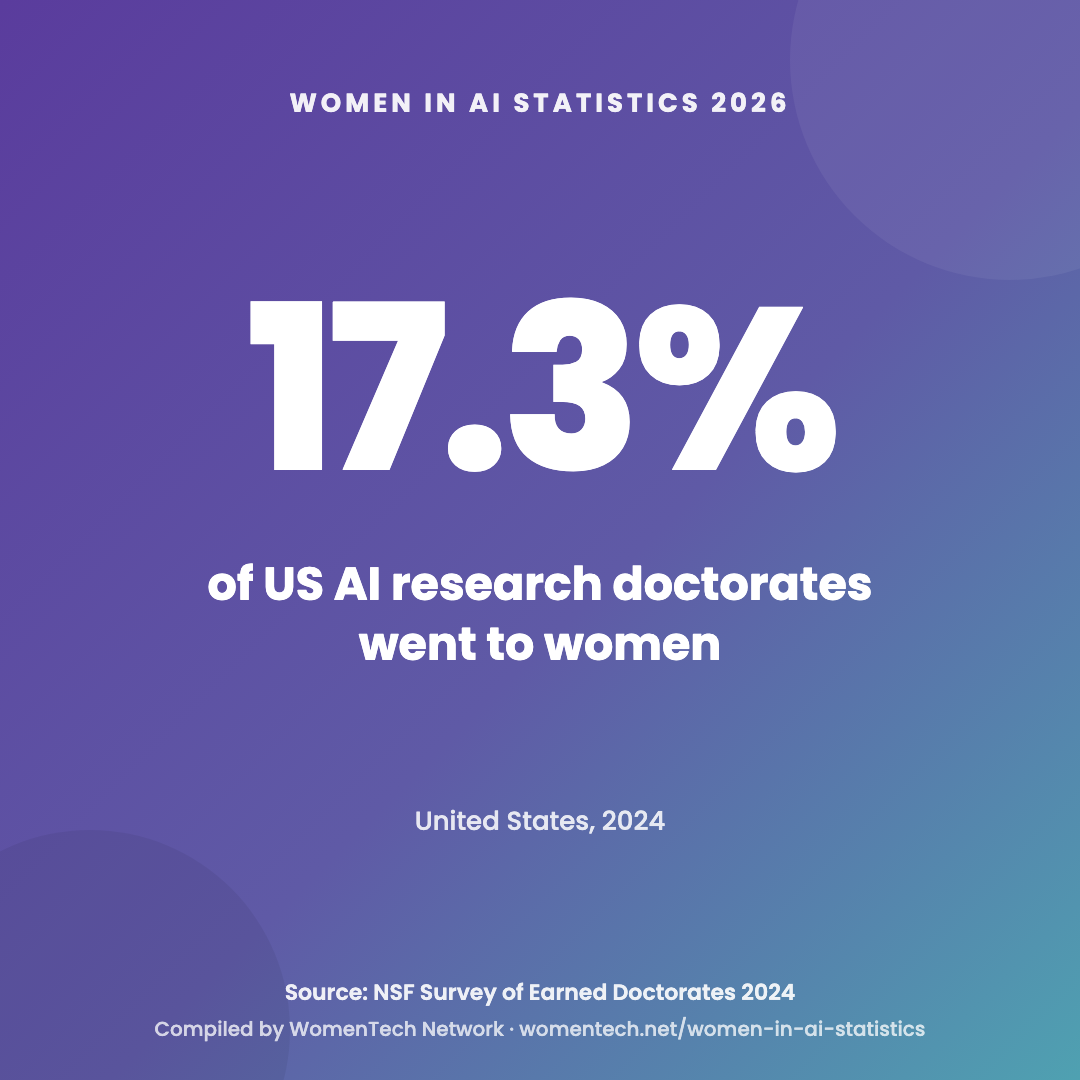
| 17.3% | Women among US AI research doctorate recipients | United States | 2024 | NSF Survey of Earned Doctorates: 51 of 295 artificial intelligence research doctorates went to women. |
| 14% | AI executive roles | Global | 2026 | Women hold about one in seven AI executive roles. |
Consumer adoption · United States
Women have nearly caught up on chatbot use
The headline adoption gap has almost closed. Frequency of use, which tools people choose and how confident they feel still differ.
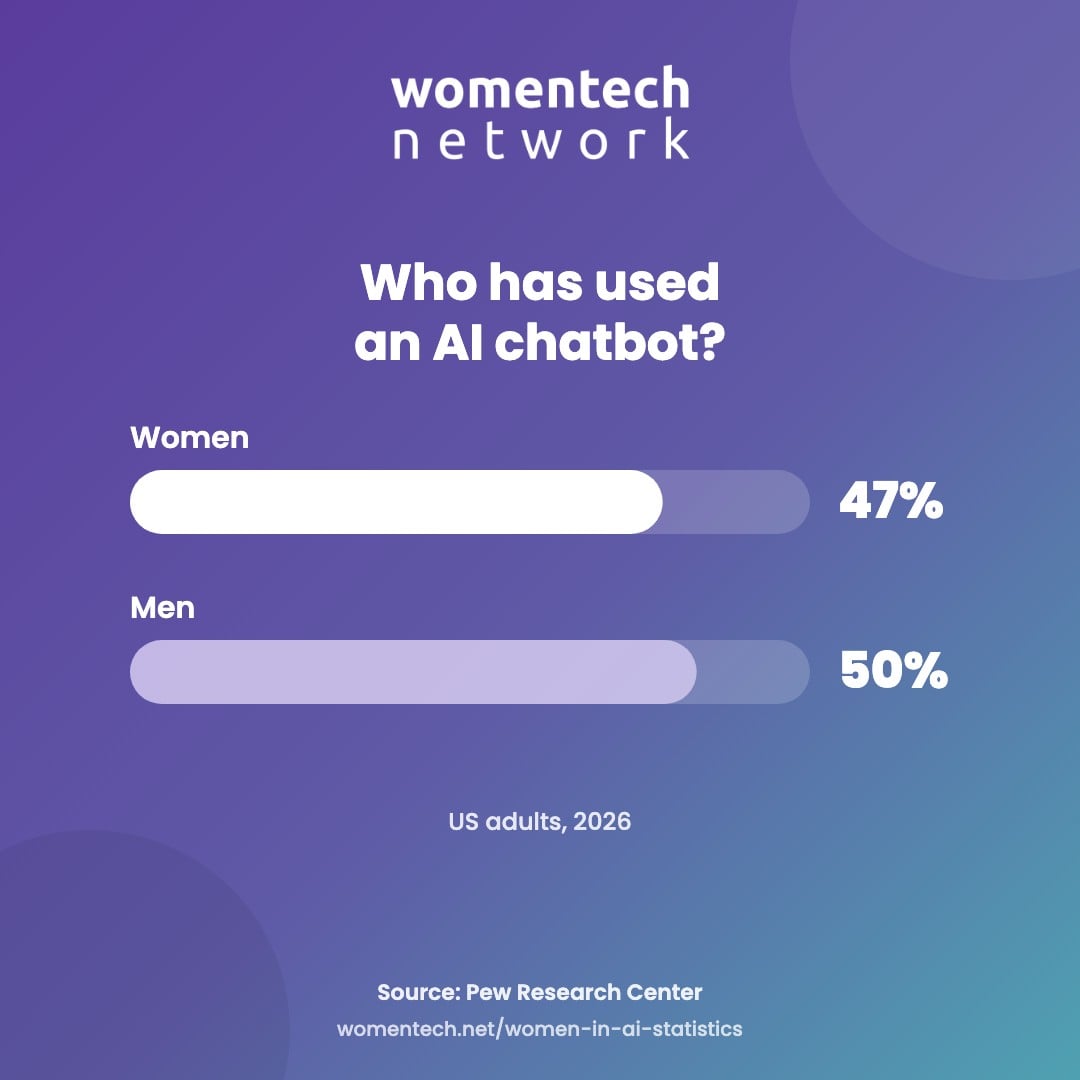
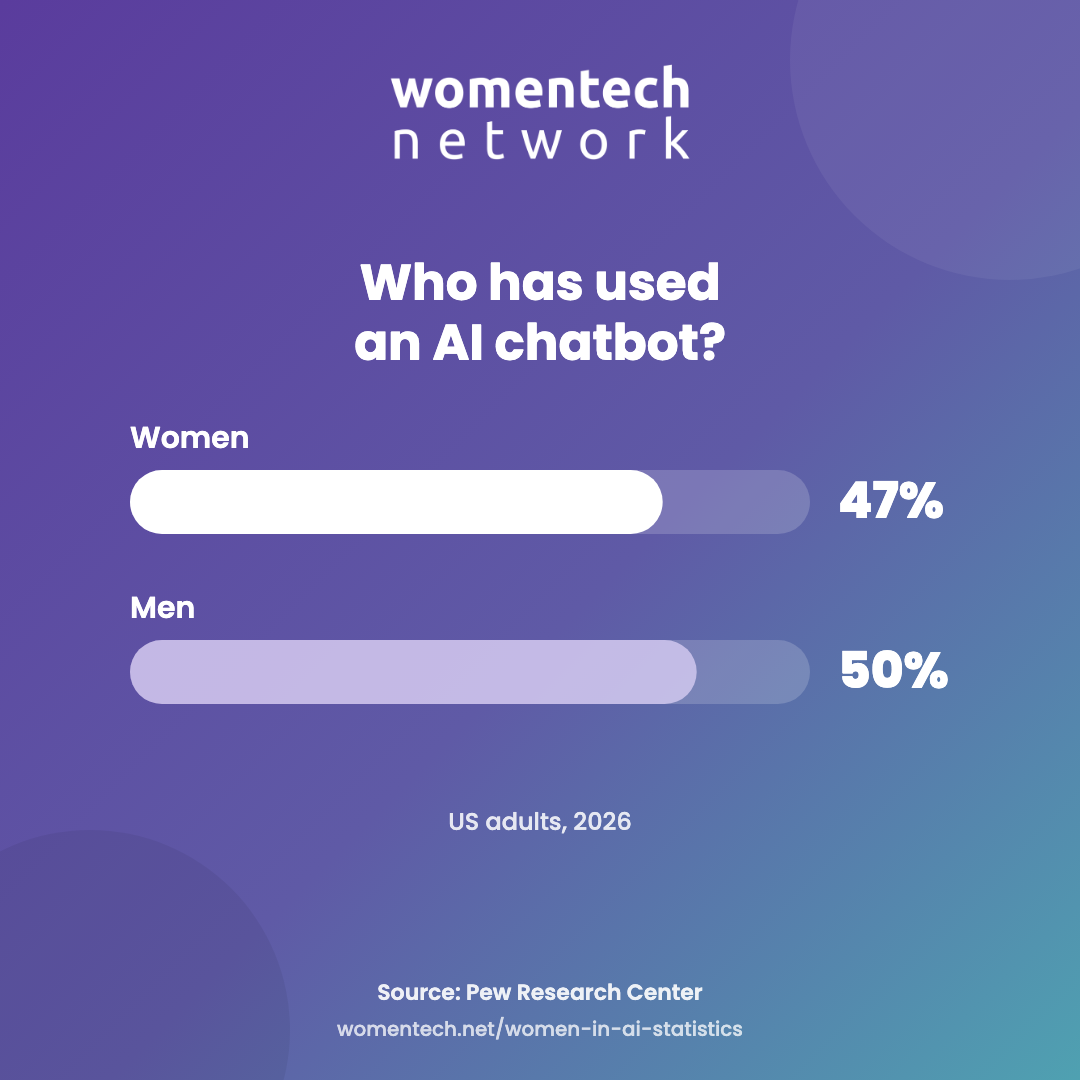
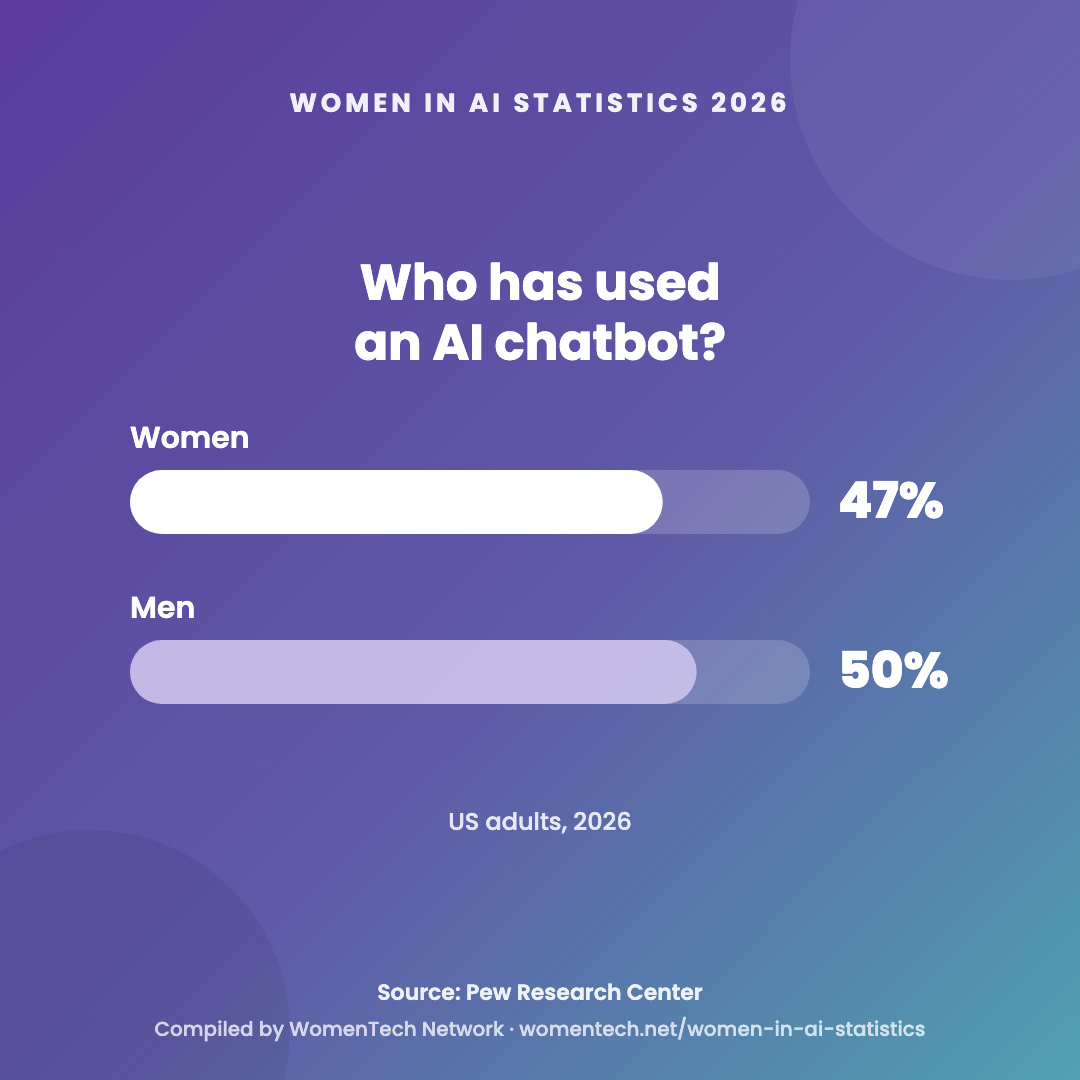
Pew’s February 2026 survey of 5,119 US adults found 47% of women and 50% of men had used an AI chatbot. Two years earlier the figures were 28% and 39%: a 19-point rise for women against 11 points for men.
ChatGPT is the one tool at parity, at 44% for both. Men reported more use of Gemini, Copilot, Grok and Claude; women were slightly more likely to use chatbots for emotional support or advice, at 11% versus 8%. Daily use stood at 20% for women and 27% for men.
AI at work
At work, women use AI less and hear less encouragement
Who is told to use AI, praised for it and trusted with it shapes who builds fluency first.
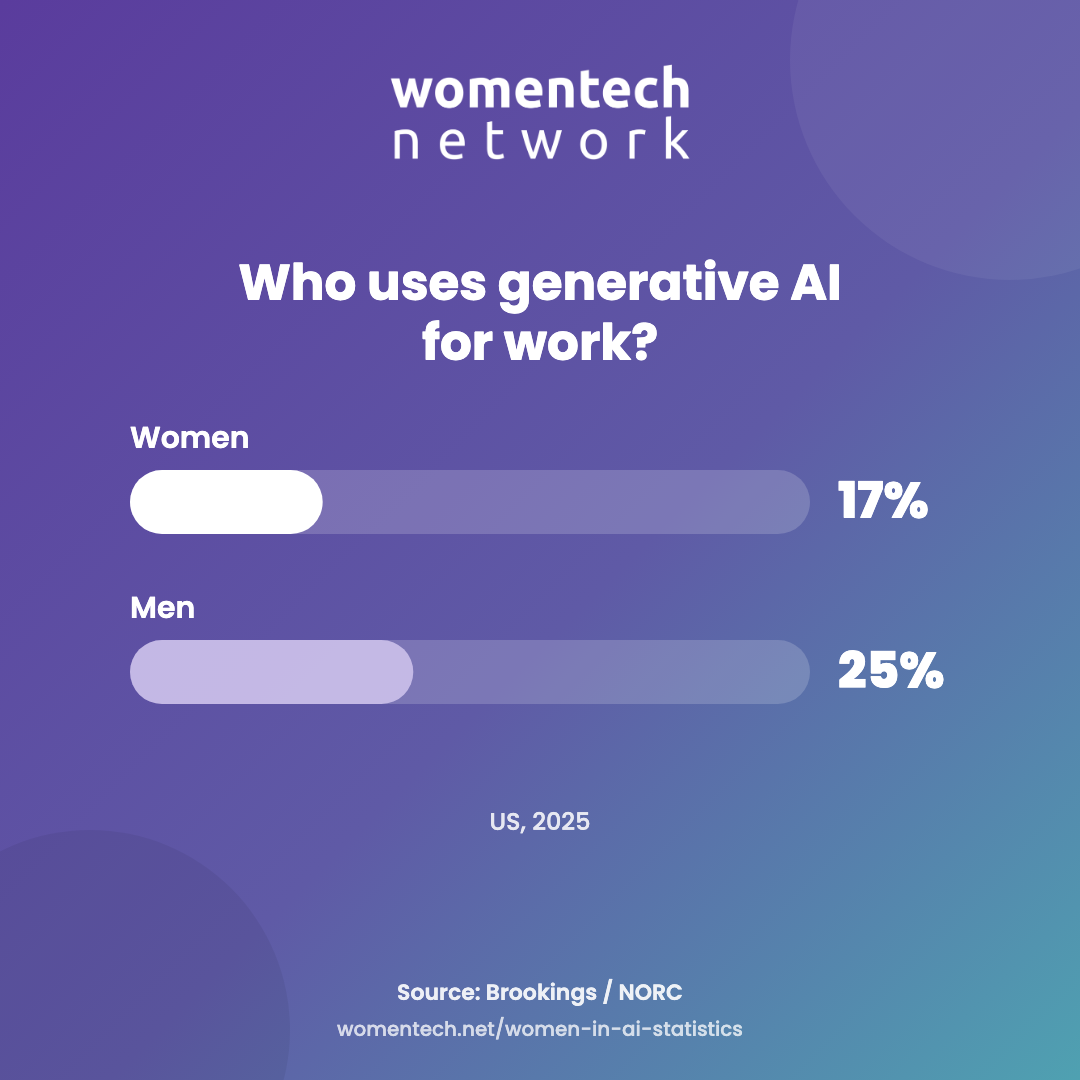
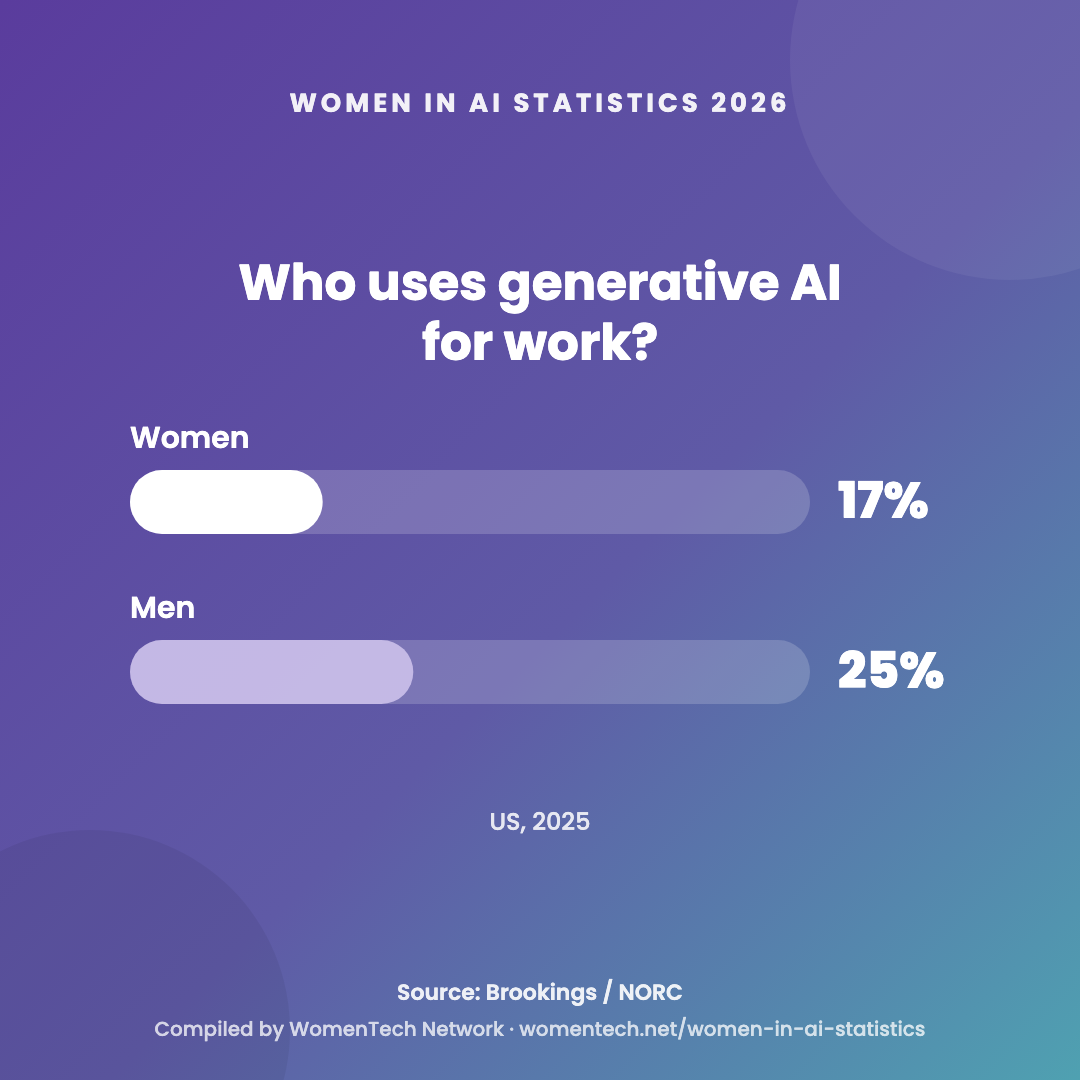
Professional GenAI use reached 17% of women and 25% of men in 2025, according to Brookings and NORC. In Lean In’s March 2026 survey, 27% of women and 33% of men said they used AI daily or constantly at work, a six-point gap.
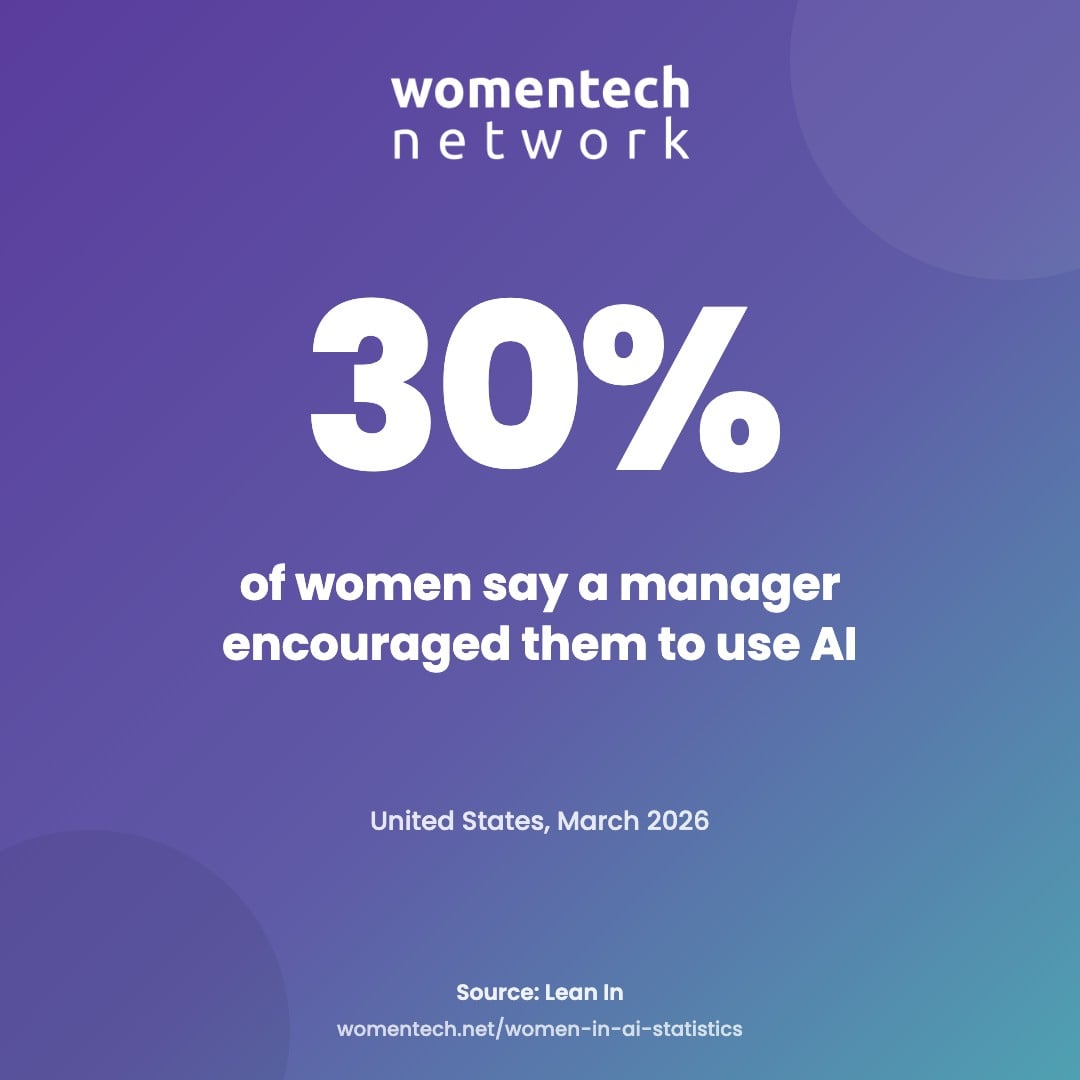
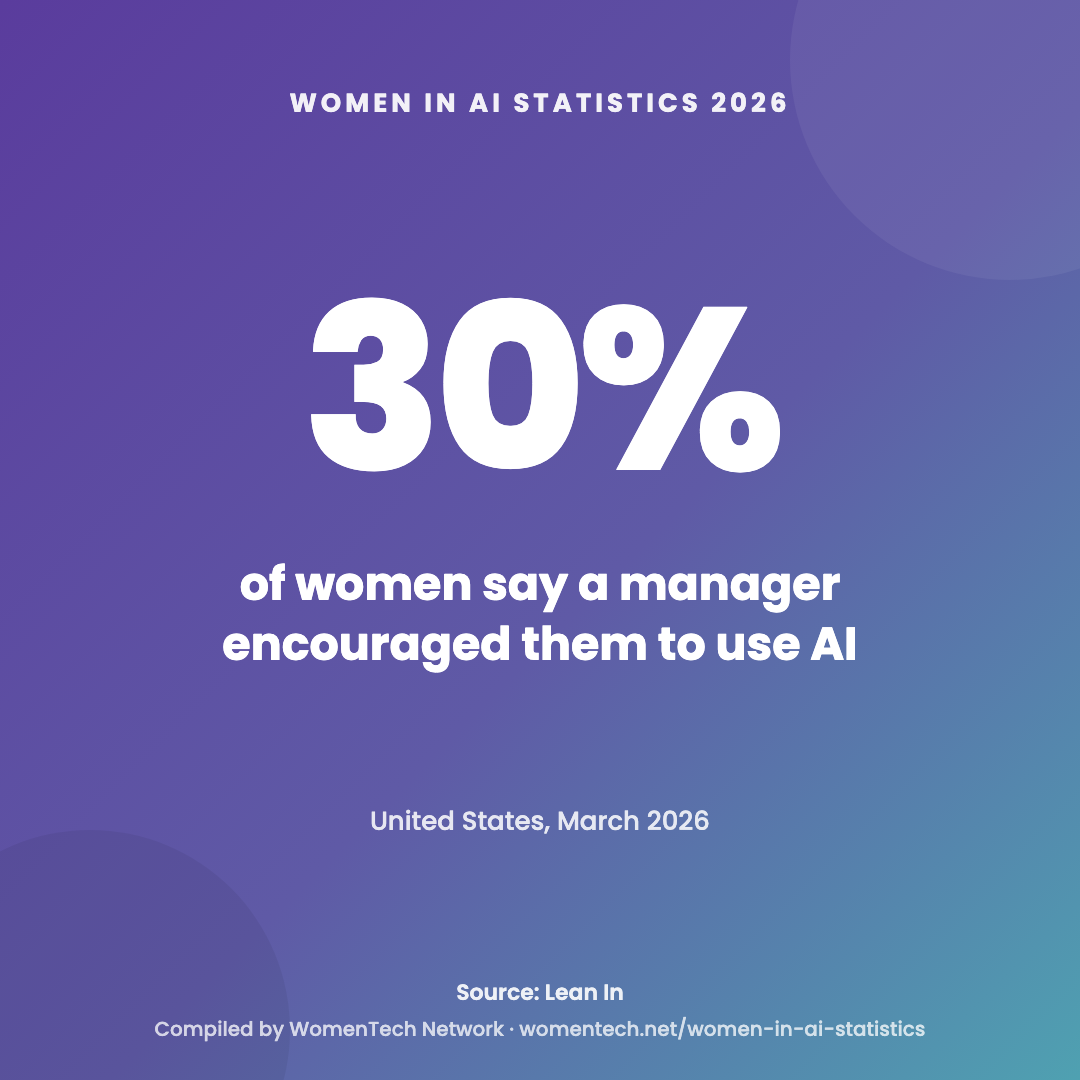
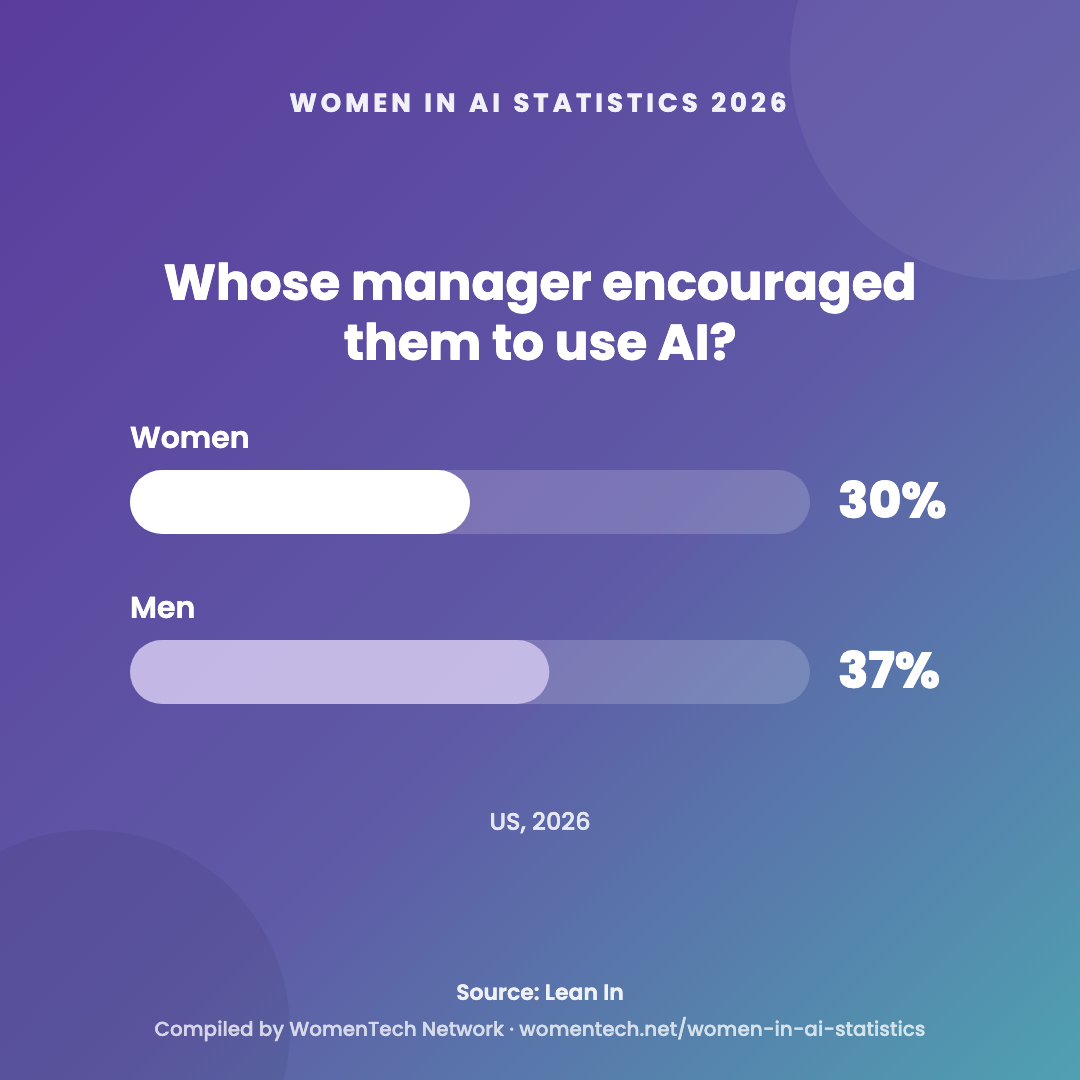
A manager had encouraged 37% of men and 30% of women to use AI, a seven-point gap; 23% of men and 18% of women who used AI at work had been praised for it, five points apart. Women were more likely to question the accuracy of outputs (22% versus 17%), to raise ethical concerns (22% versus 16%) and to worry that using AI might be seen as cheating (29% versus 22%).

Exposure and transition
Women’s jobs carry more generative-AI exposure
Exposure is not displacement. The risk concentrates where highly exposed roles meet limited room to move.
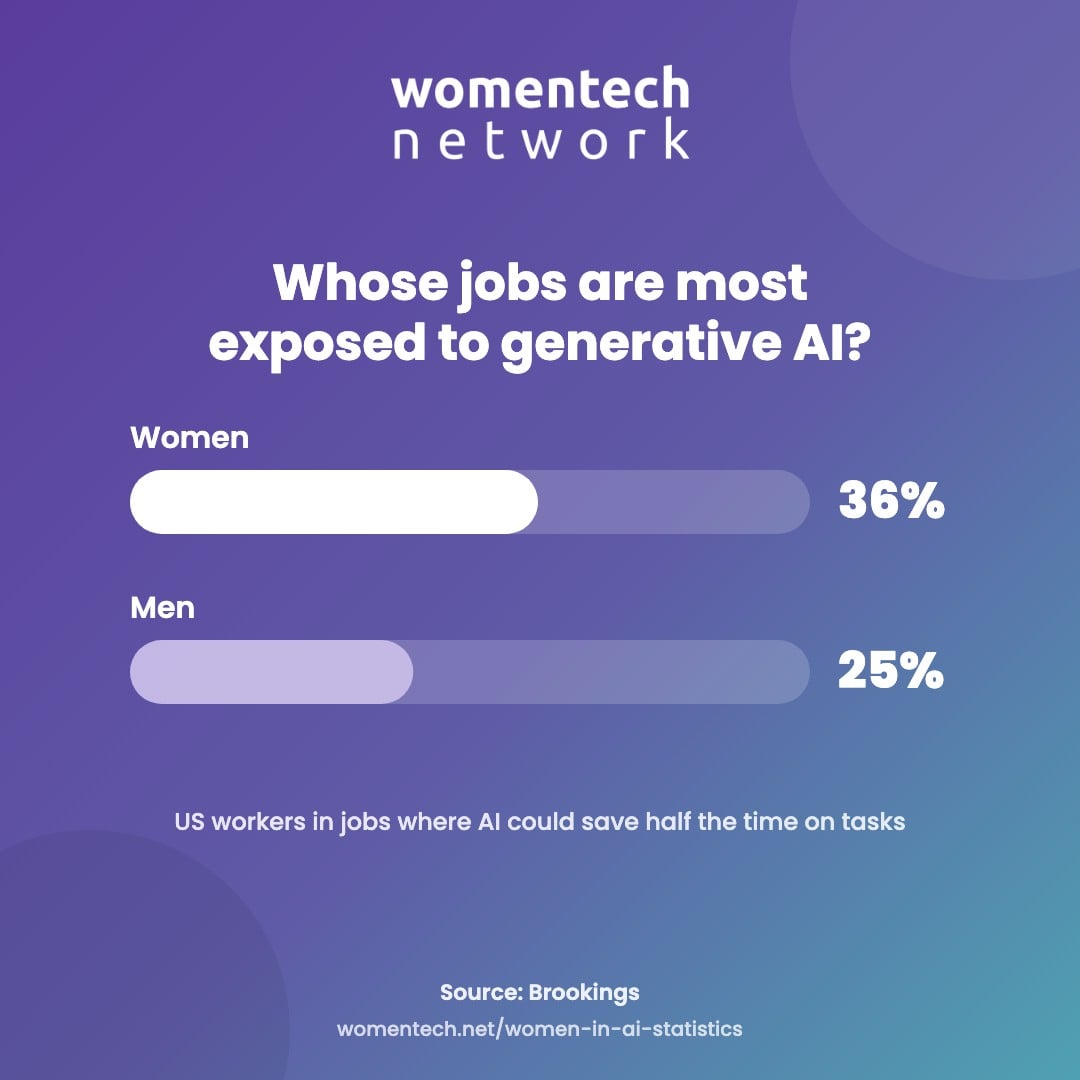
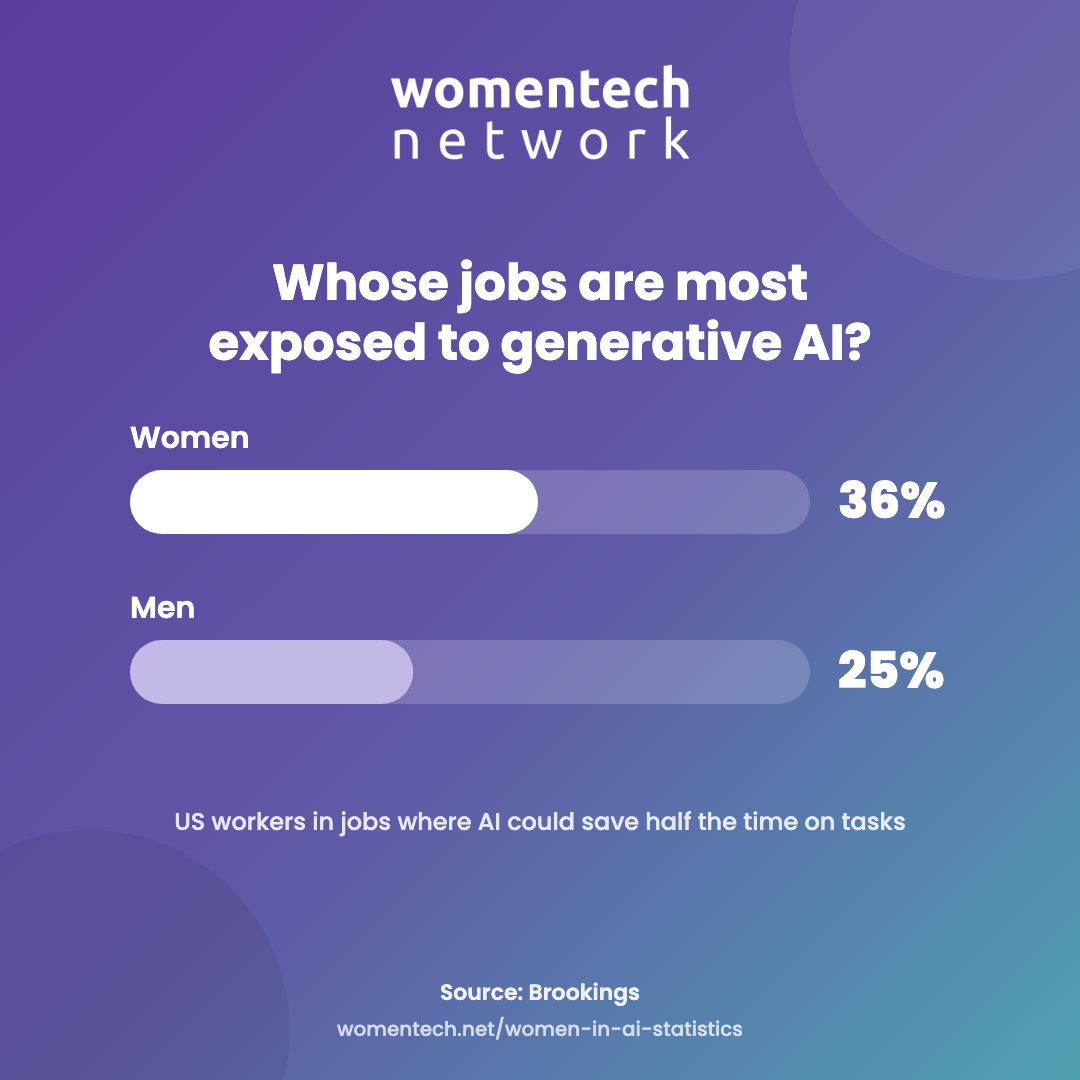
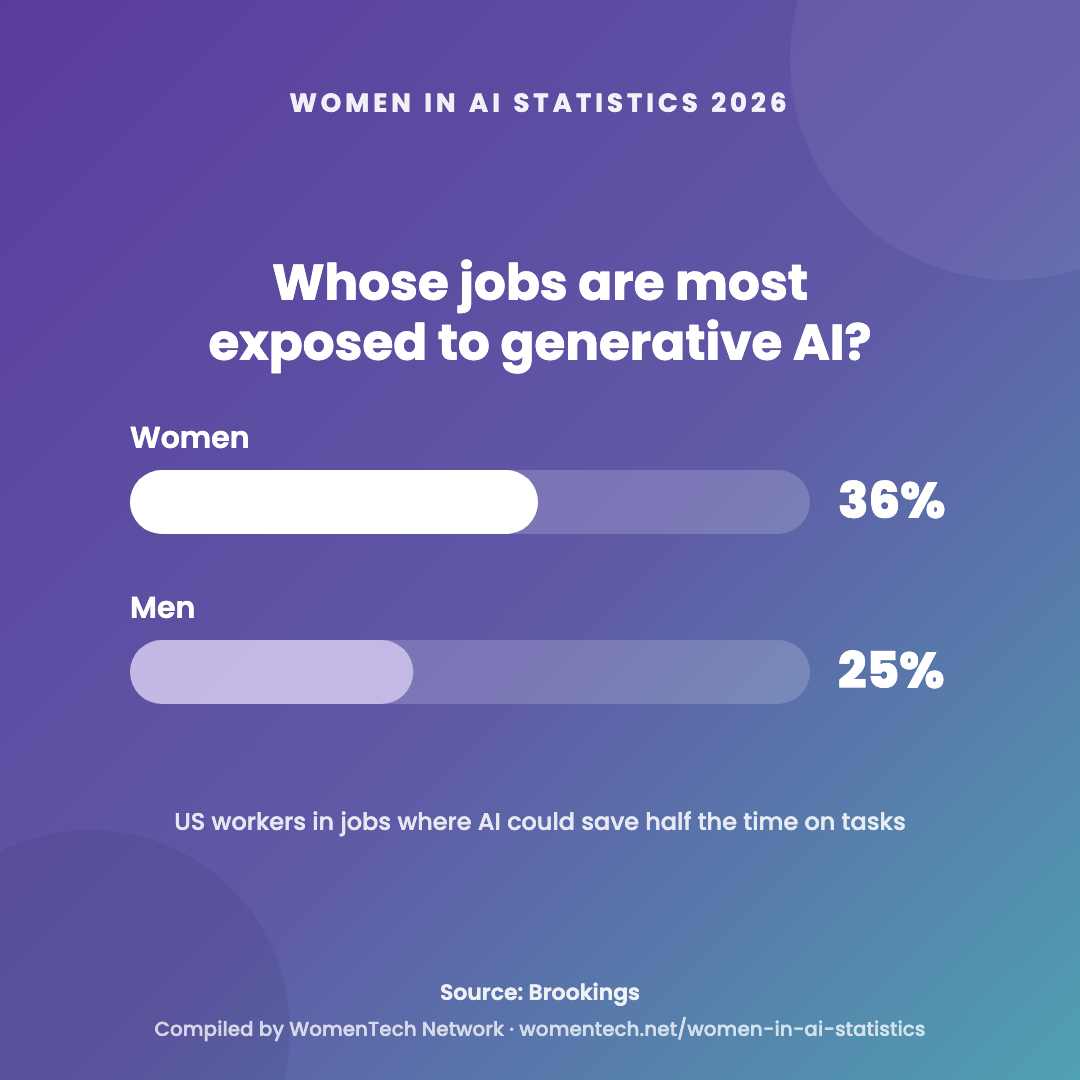
Brookings estimated that 36% of women workers in the US, versus 25% of men, hold occupations in which generative AI could save at least half the time spent on tasks. Across 84 countries, the ILO measured 29% exposure in female-dominated occupations and 16% in male-dominated ones.
Most of that exposure will show up as changed tasks rather than lost jobs. The transition becomes harder when high exposure meets limited savings, fewer local openings and skills that do not transfer easily.
Labor demand · United States
Demand for AI-building roles keeps rising
Federal projections show which occupations grow and which contract, and therefore where reskilling pays off.
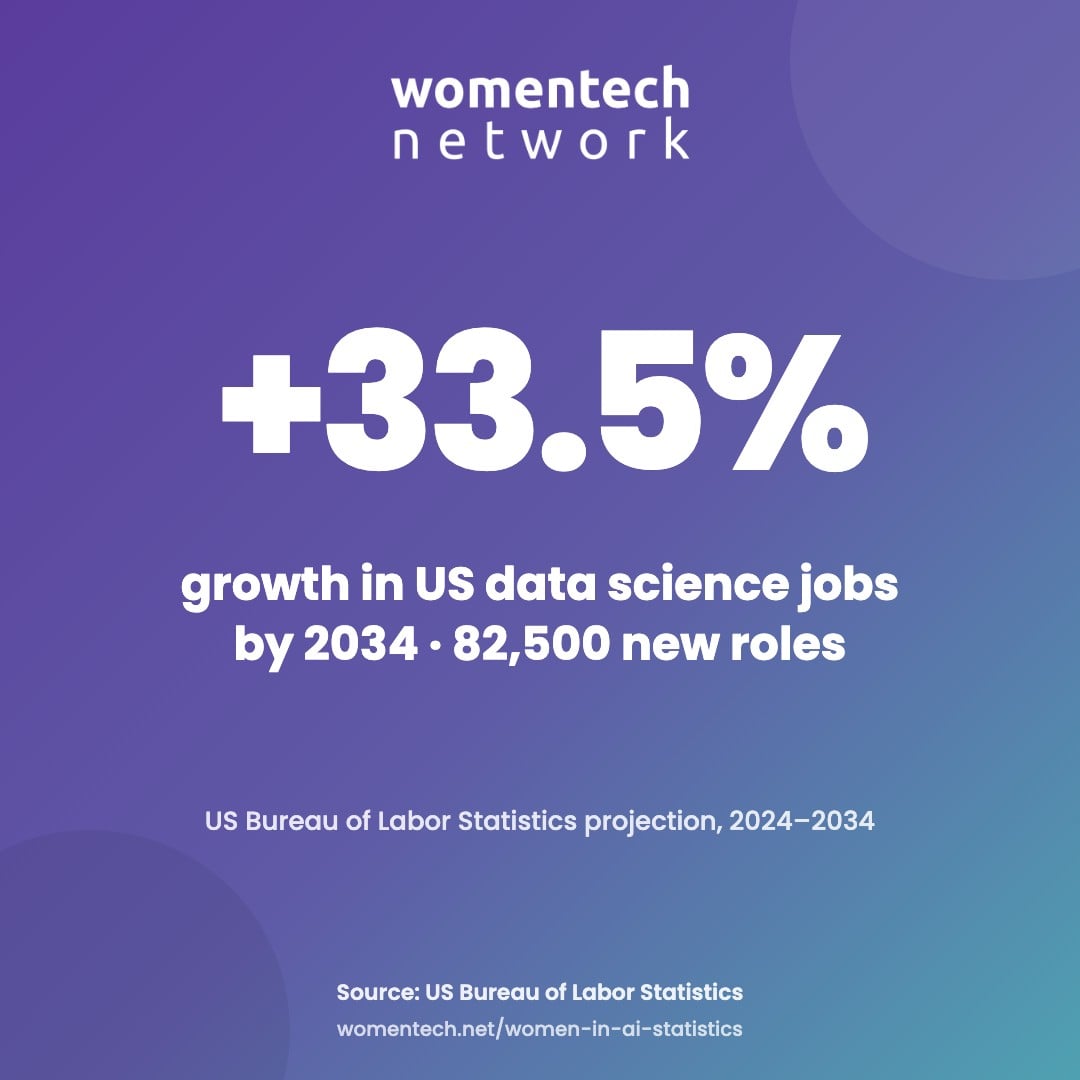
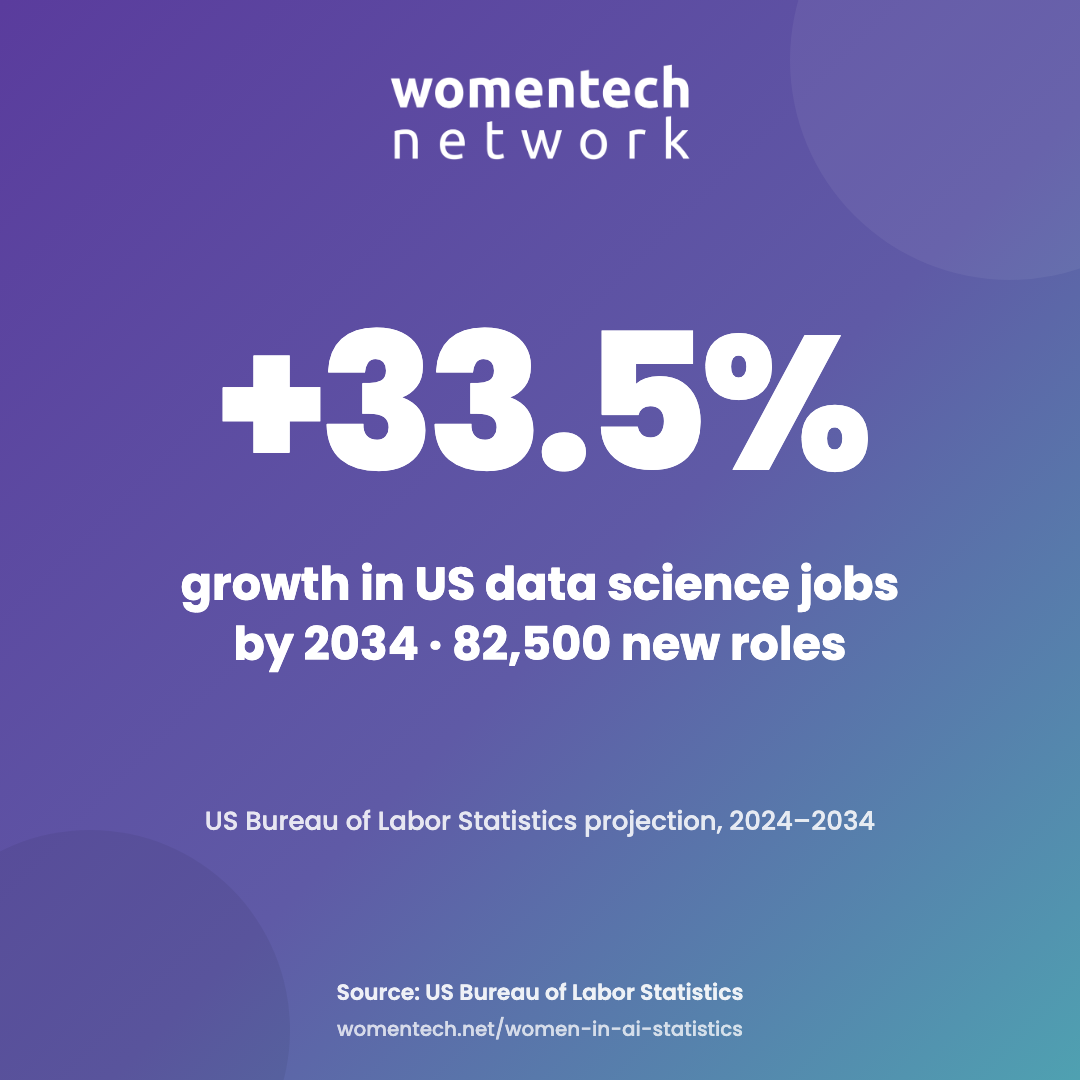
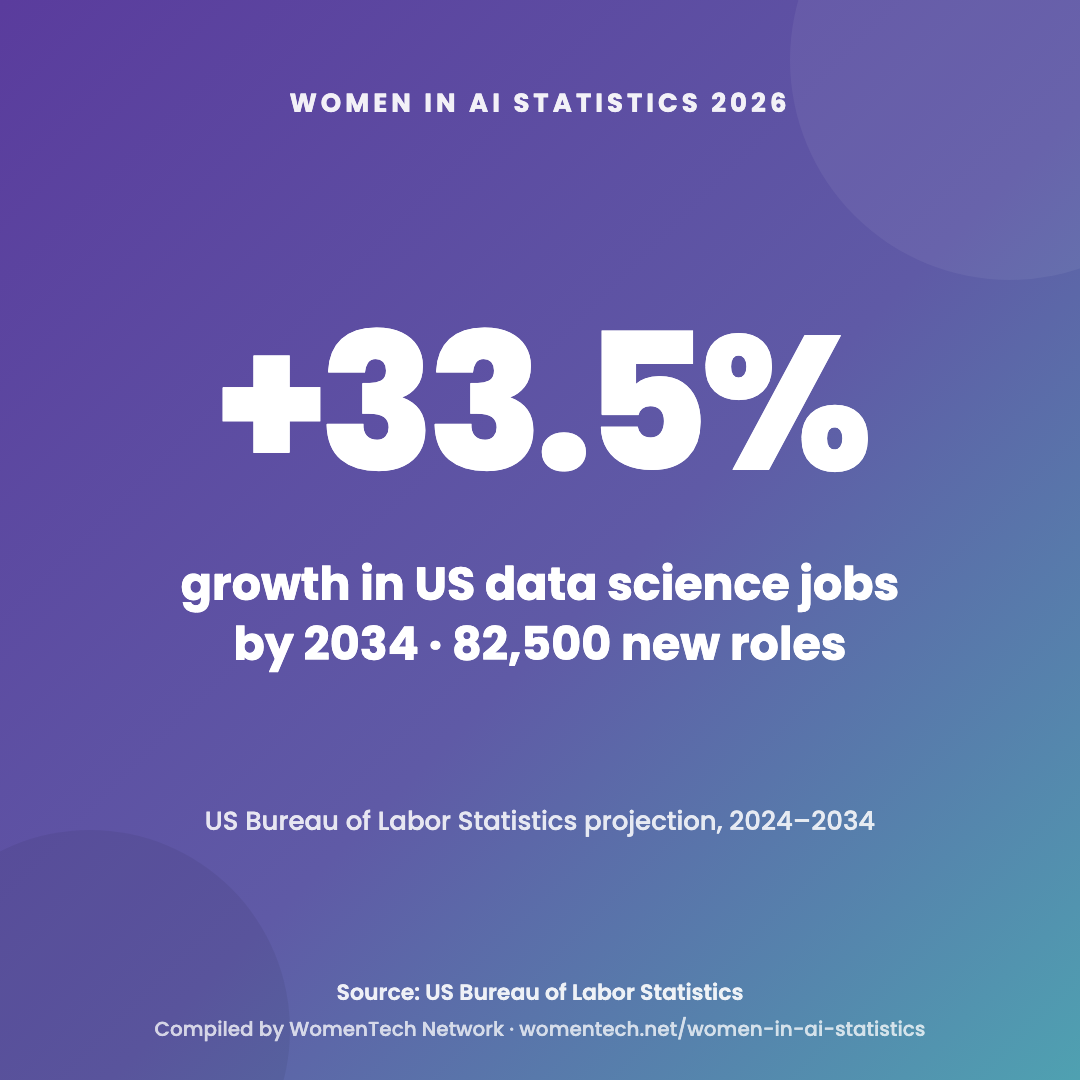
The US Bureau of Labor Statistics projects strong growth between 2024 and 2034 for data scientists, information security analysts, operations research analysts, computer and information research scientists and software developers, the occupations that build and run AI systems.
The same projections show declines in administrative occupations: customer service representatives (-5.5%), procurement clerks (-8.7%), credit authorizers, checkers and clerks (-6.2%) and legal secretaries and administrative assistants (-5.8%). Stanford counted AI skills in 2.56% of all US job postings in 2025, and California alone accounted for 17.18% of US AI postings.
Skills pipeline
More women are learning GenAI, fewer reach research roles
Enrollment momentum is real. Representation at PhD and research level has not moved as fast.
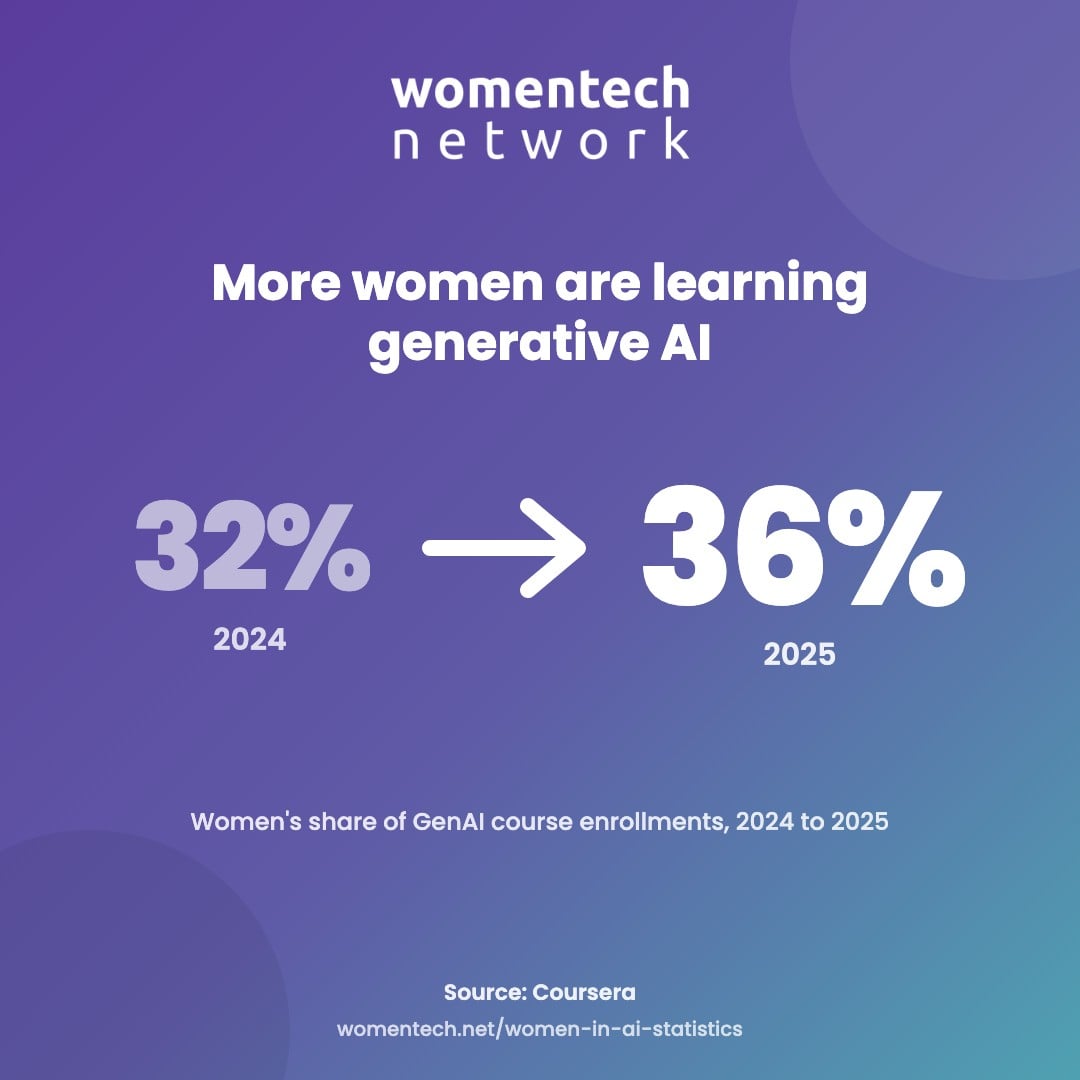
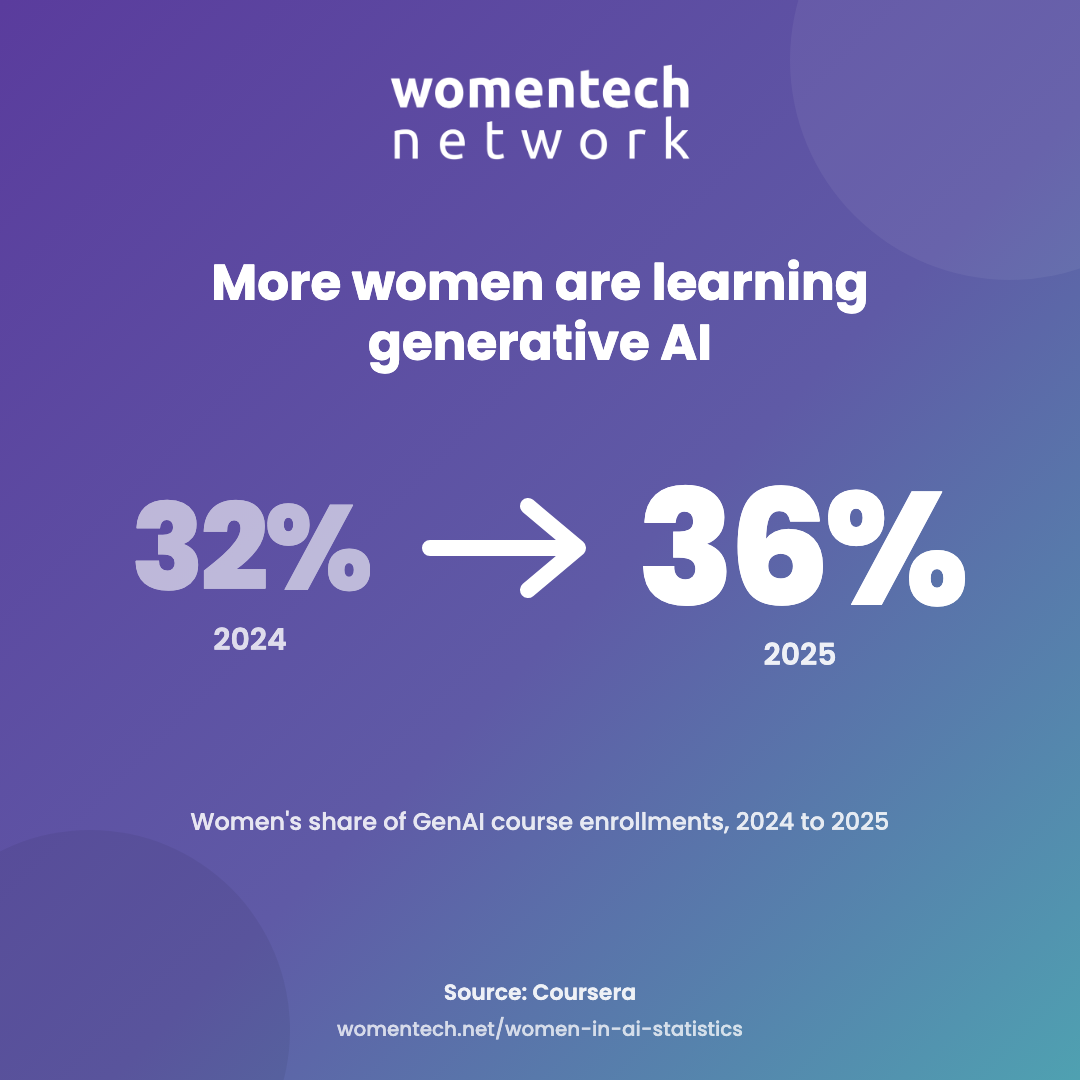
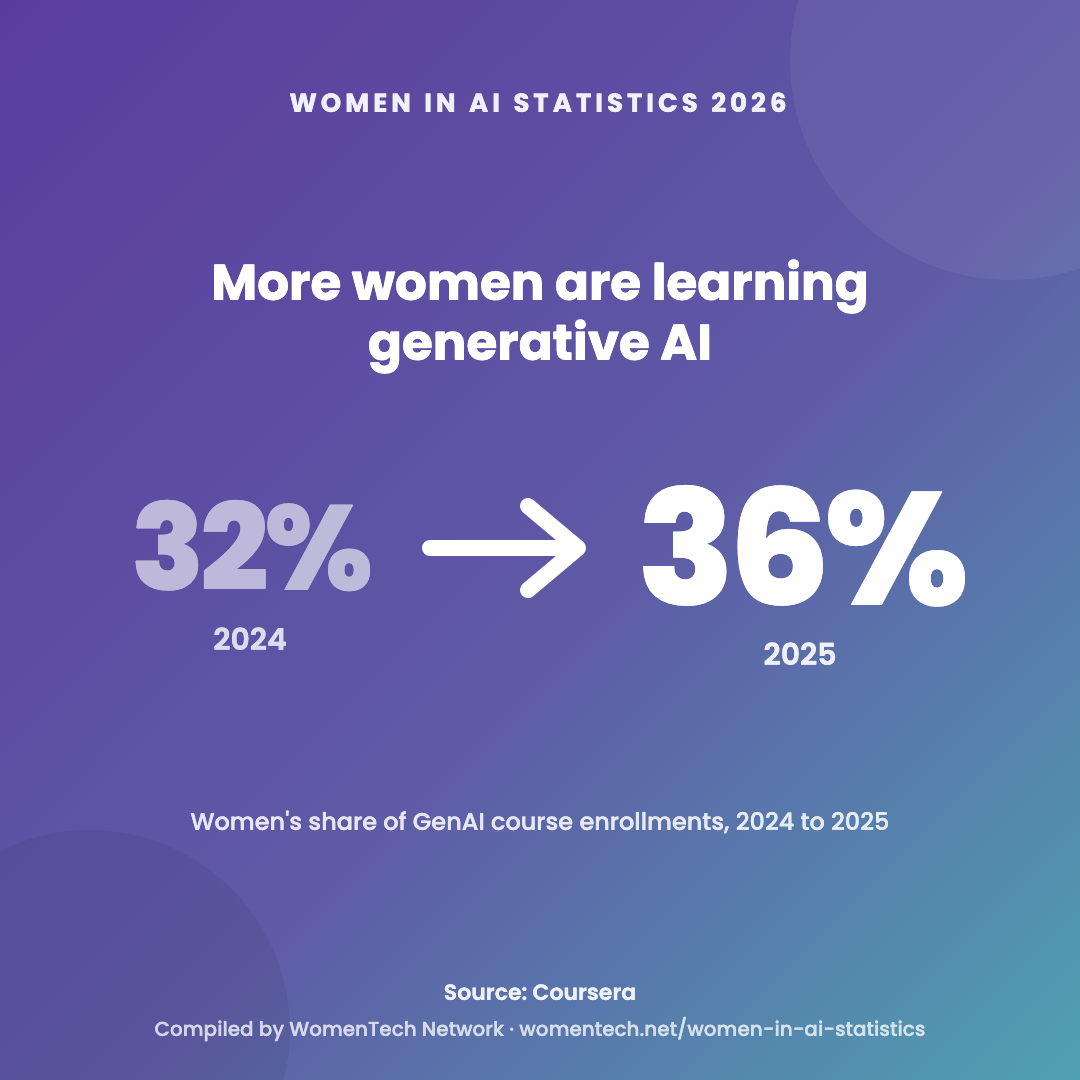
On Coursera, women’s share of global GenAI enrollments climbed from 32% in 2024 to 36% in 2025; among employer-sponsored learners it rose from 36% to 42%.
The advanced end of the pipeline still lags; the research-pipeline section below tracks that gap from doctorates to faculty hiring.
Venture capital · United States
A record year for women-founded companies, driven by two AI deals
The total is historic. The distribution is not.
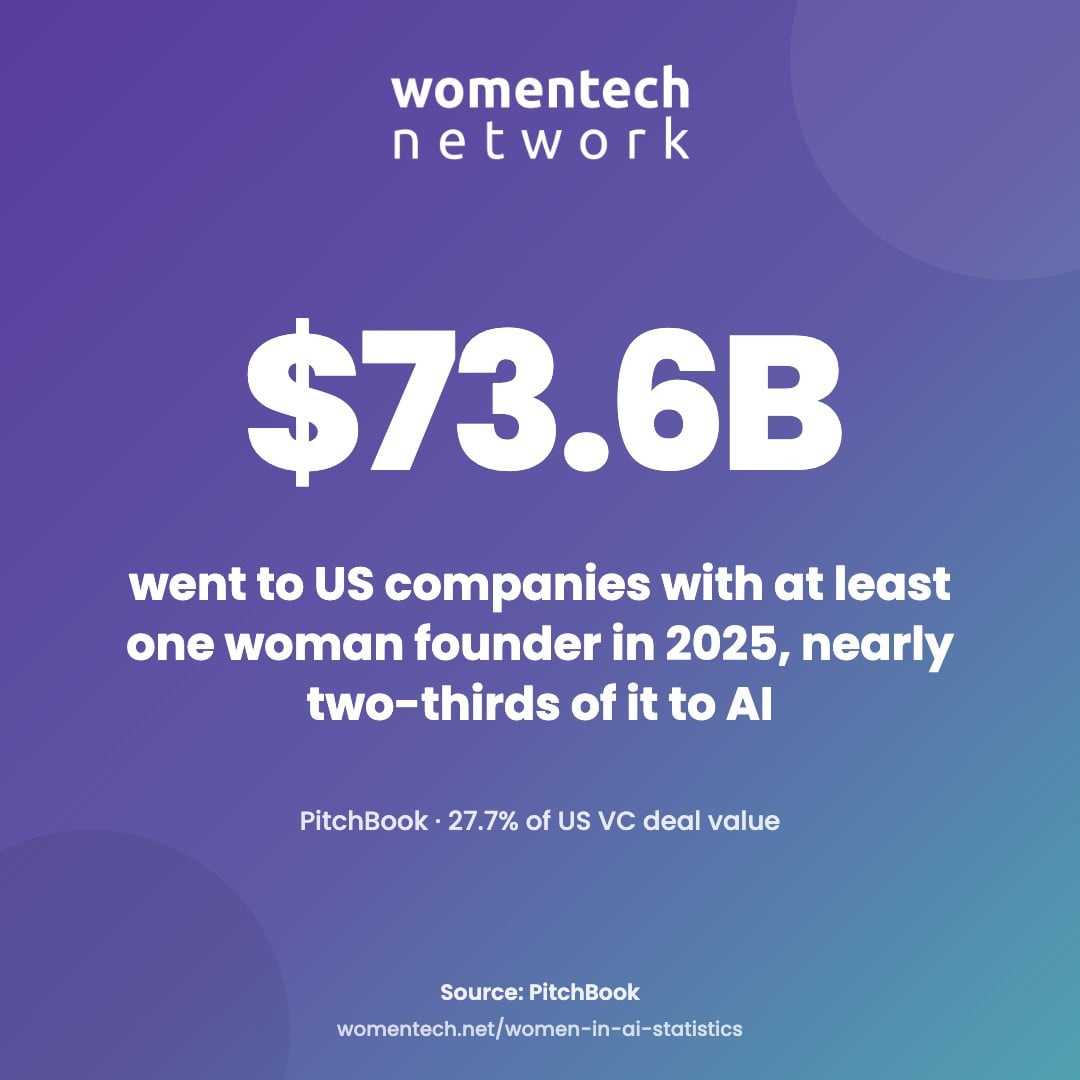
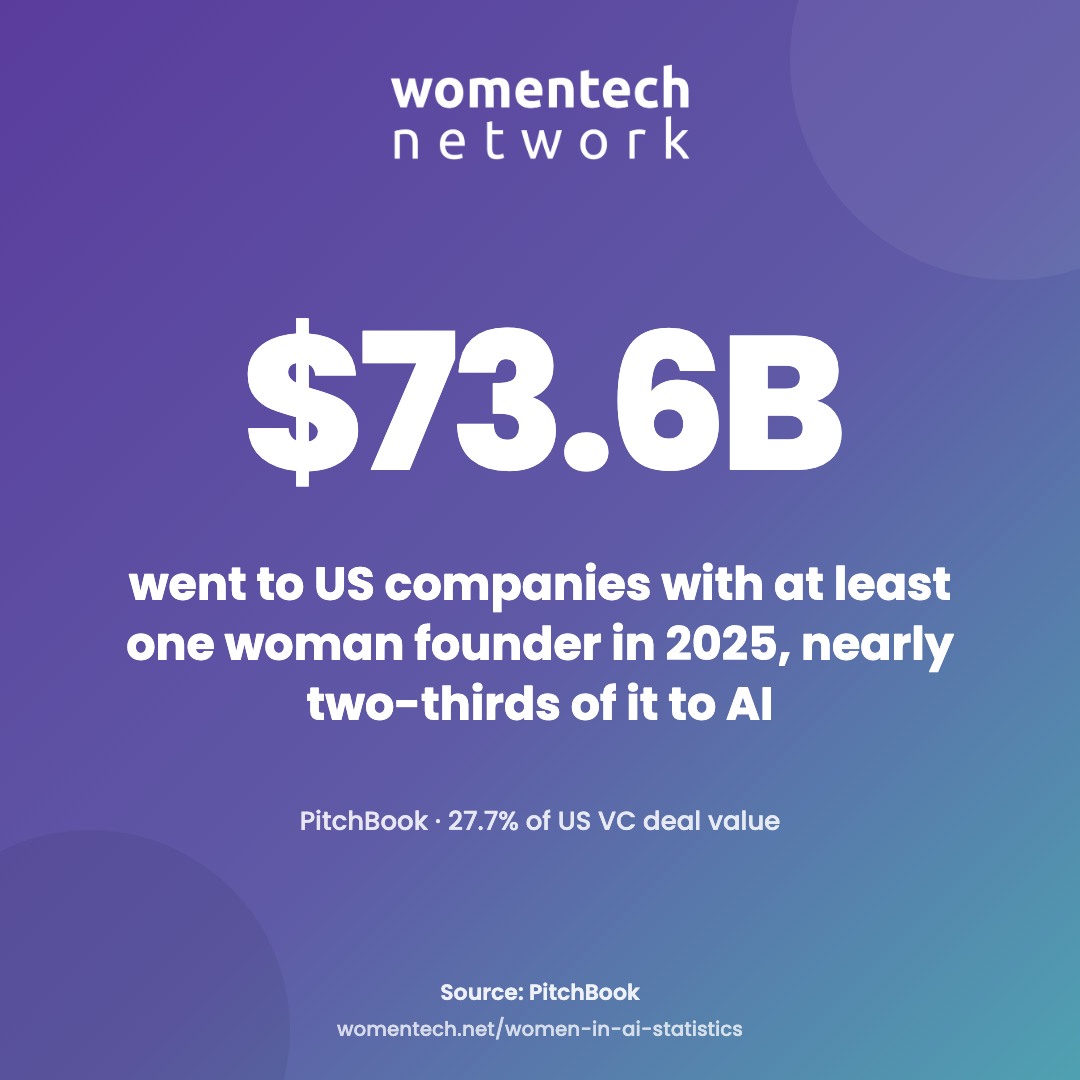
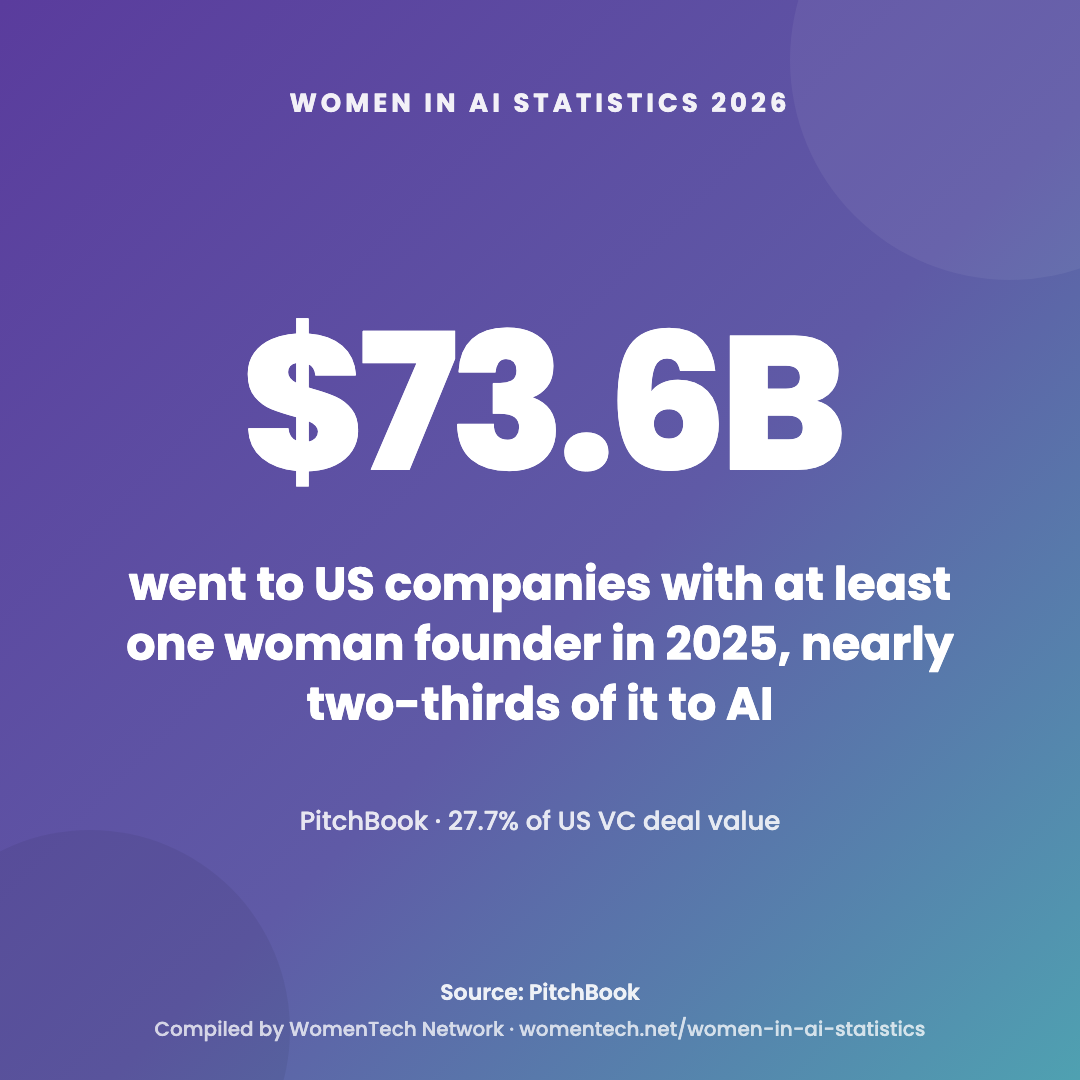
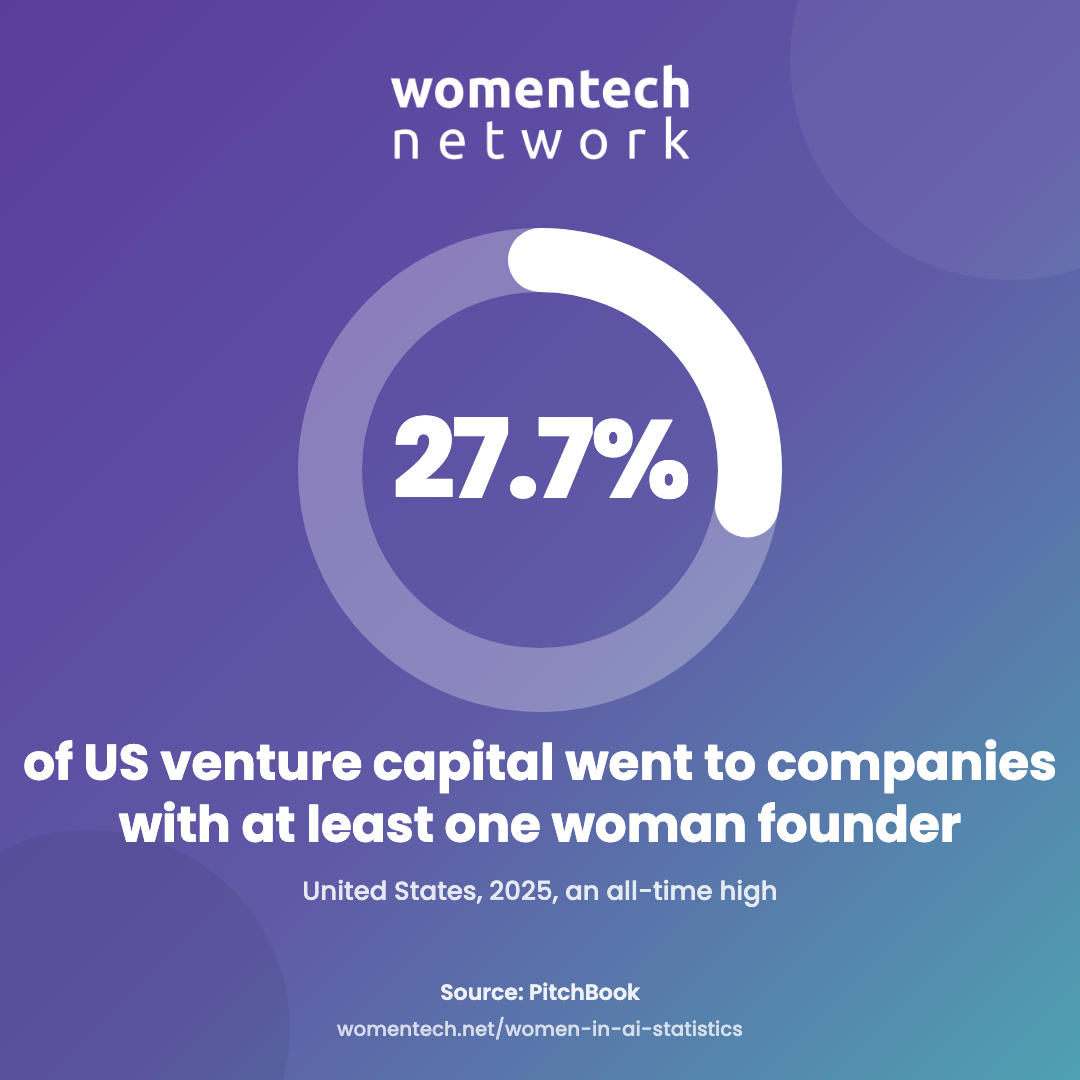
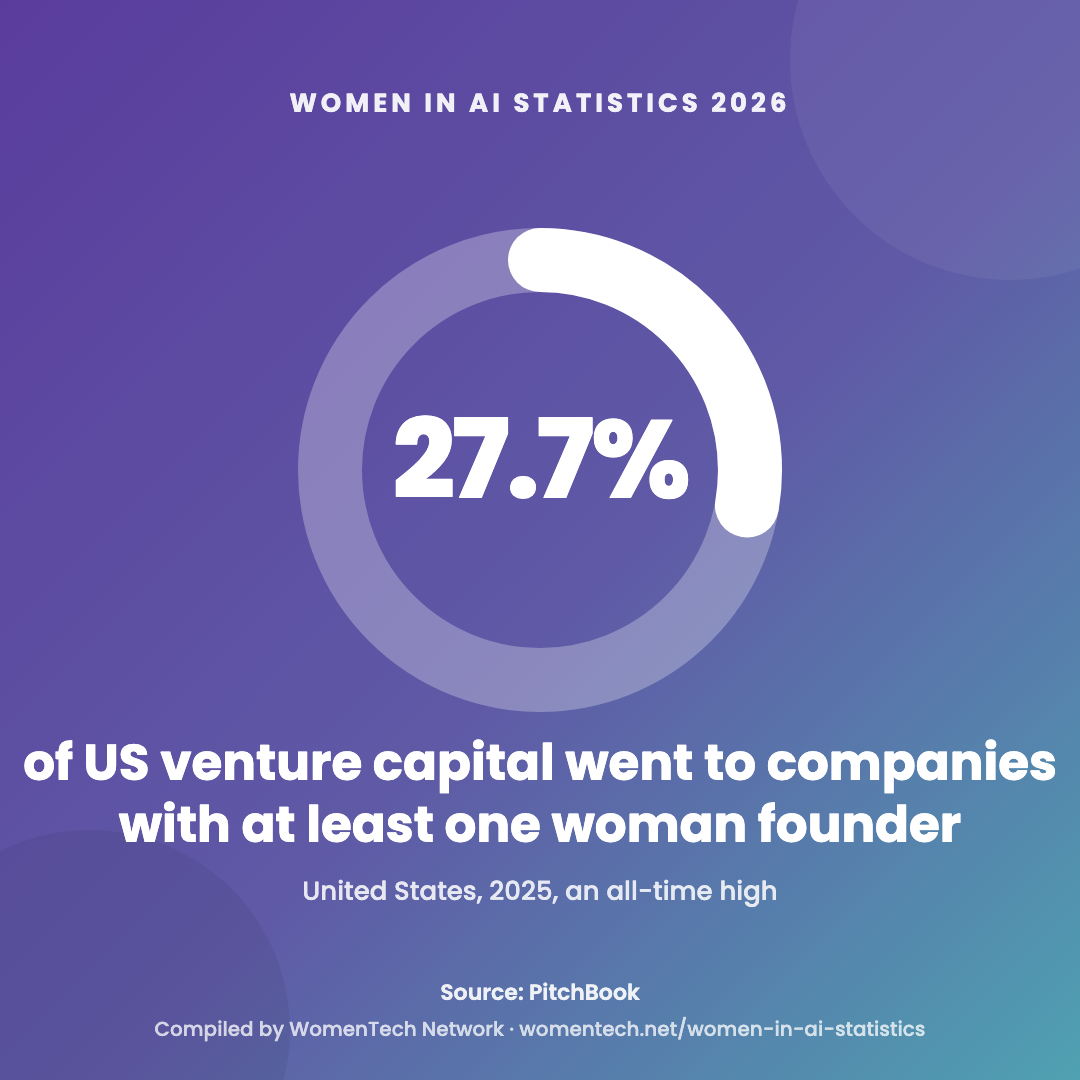
PitchBook counted a record $73.6 billion raised in 2025 by US companies with at least one woman founder. Roughly two-thirds of that money went to AI companies; the cohort itself spans every sector, not only AI.
Scale AI and Anthropic together account for more than $30 billion of it, so capital stayed highly concentrated, above all outside the largest mixed-gender founding teams.
Founders
Who is funding women AI founders?
A record US total concentrated in a few AI megadeals; a declining share in Europe.
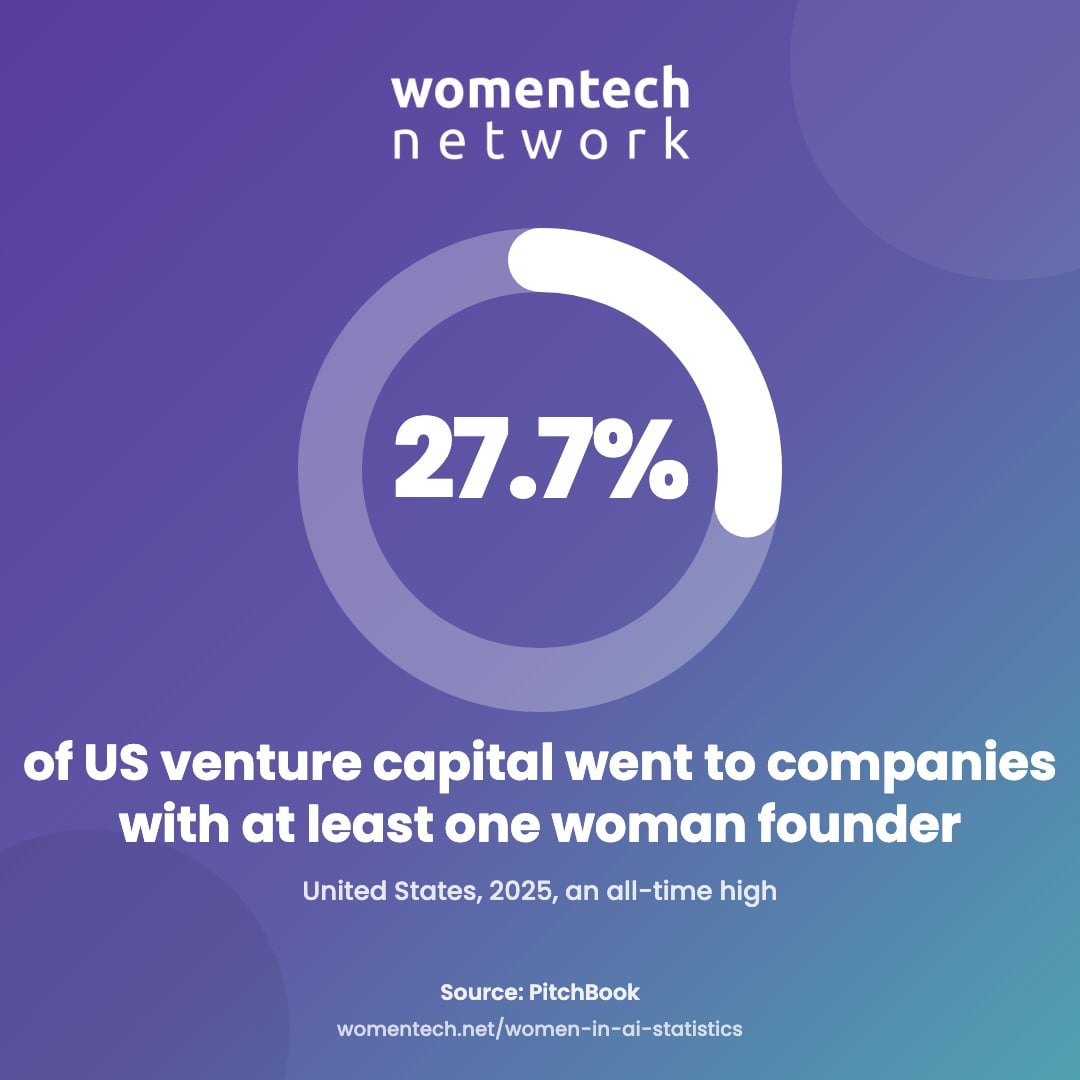
Companies with at least one woman founder took an all-time-high share of US VC deal value in 2025, according to PitchBook, with AI megadeals led by Scale AI and Anthropic behind the record. The cohort made up 25% of US exit count and reached a record $481 billion in aggregate unicorn valuation.
In Europe, female-founded companies’ share of overall deal activity trended down in 2025 as megadeals pulled back, even though their unicorn valuations reached a record. PitchBook also tracks funding by founder mix, distinguishing all-women, mixed-gender and all-men founding teams; those categories are reported separately from the broader at-least-one-woman-founder measure.
The State of Women in AI 2026 study does not ask about fundraising; it asks women in every role, founders included, what they have built, shipped and led with AI and what holds them back, while PitchBook remains the source for the funding figures.
Leadership
What share of AI leadership roles do women hold?
The higher the seat, the fewer the women. In AI companies, the C-suite is where the share is lowest.
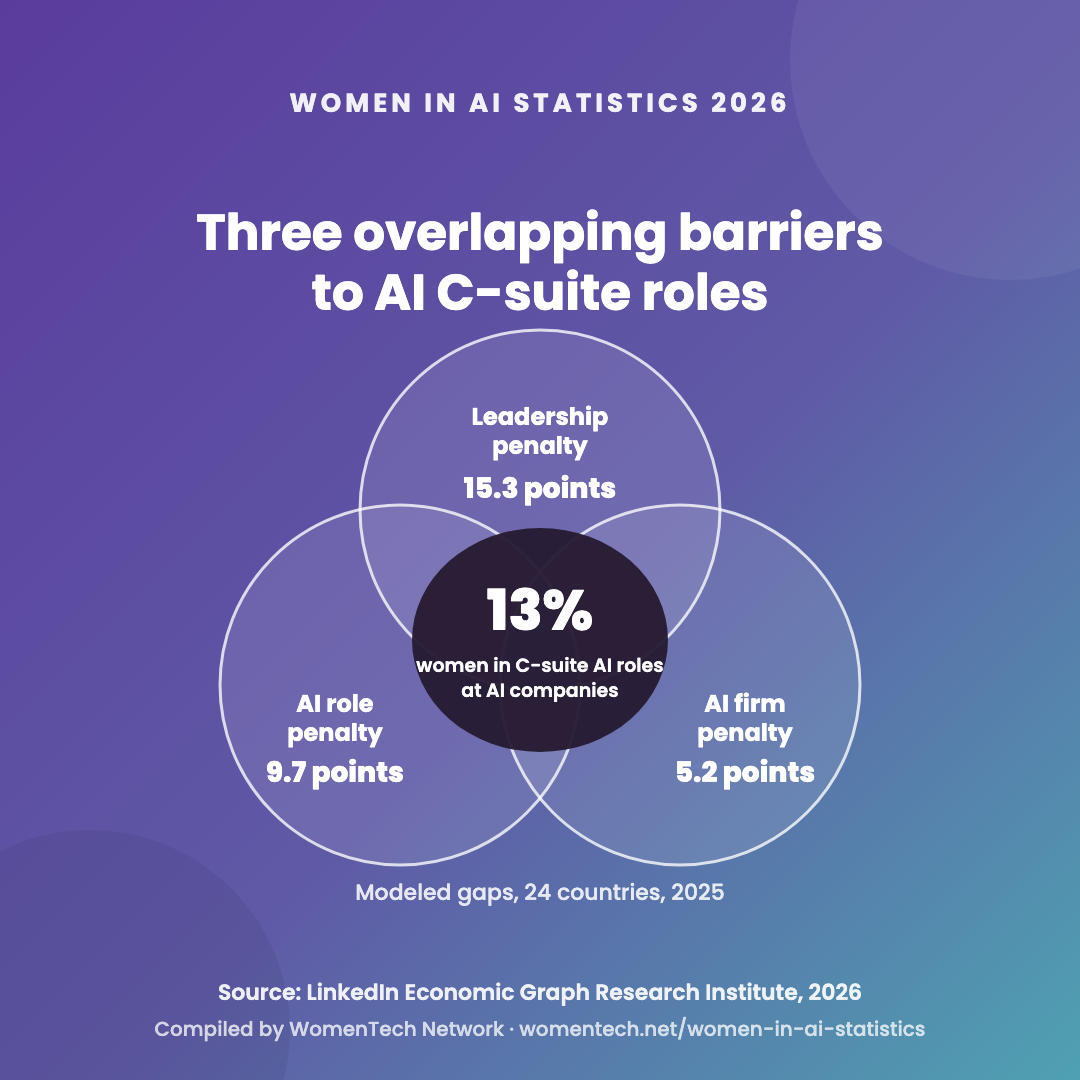
LinkedIn’s Economic Graph Research Institute measured AI leadership across 27 countries in August 2026. One level below the C-suite, at Director and above, women were 31.2% of AI leaders against 38.5% of leaders overall; at C-suite level inside AI companies the share drops to roughly one seat in eight.
LinkedIn calls it a triple penalty: reaching the C-suite is associated with a 15.3 percentage-point gap, working in an AI role with a 9.7-point gap and working at an AI company with a 5.2-point gap, each estimated after accounting for other factors. The three figures describe different parts of the pipeline; they are not additive and not a headcount. IMD’s 2026 estimate of women in 14% of AI executive roles worldwide sits in the same range.
Whether women are encouraged to lead AI initiatives, included in AI governance and decision-making, and see women role models in AI are questions the State of Women in AI 2026 study puts to women directly, so next year’s figures can go beyond executive headcounts.


Research pipeline
Is the AI research pipeline opening up to women?
Slowly. Faculty hiring is moving faster than the researcher headcount.
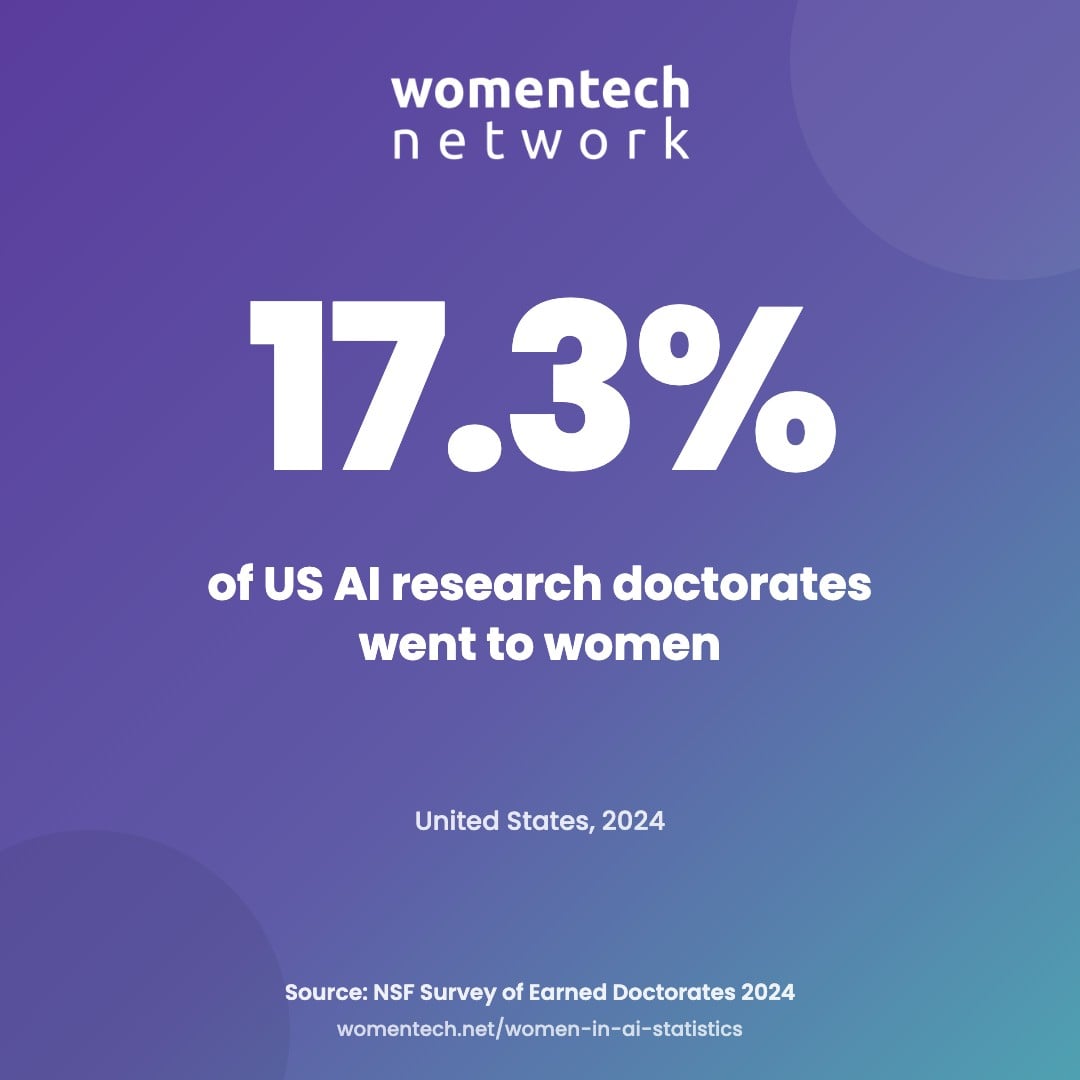
Women are an estimated 12% of AI researchers (UNESCO); in the United States, 51 of the 295 artificial intelligence research doctorates awarded in 2024 went to women (NSF Survey of Earned Doctorates).
The clearest movement is in hiring: women rose from 24.9% to 30.2% of new computer science, computer engineering and information faculty hires between 2017 and 2021, though men were still 75.9% of that faculty. Further down the pipeline, women were 36% of global GenAI course enrollments on Coursera in 2025.
Researchers, doctoral students and faculty are invited to the State of Women in AI 2026 study; their responses map the pipeline the headcounts only hint at.
Hiring and pay
What do we know about women, AI hiring and AI pay?
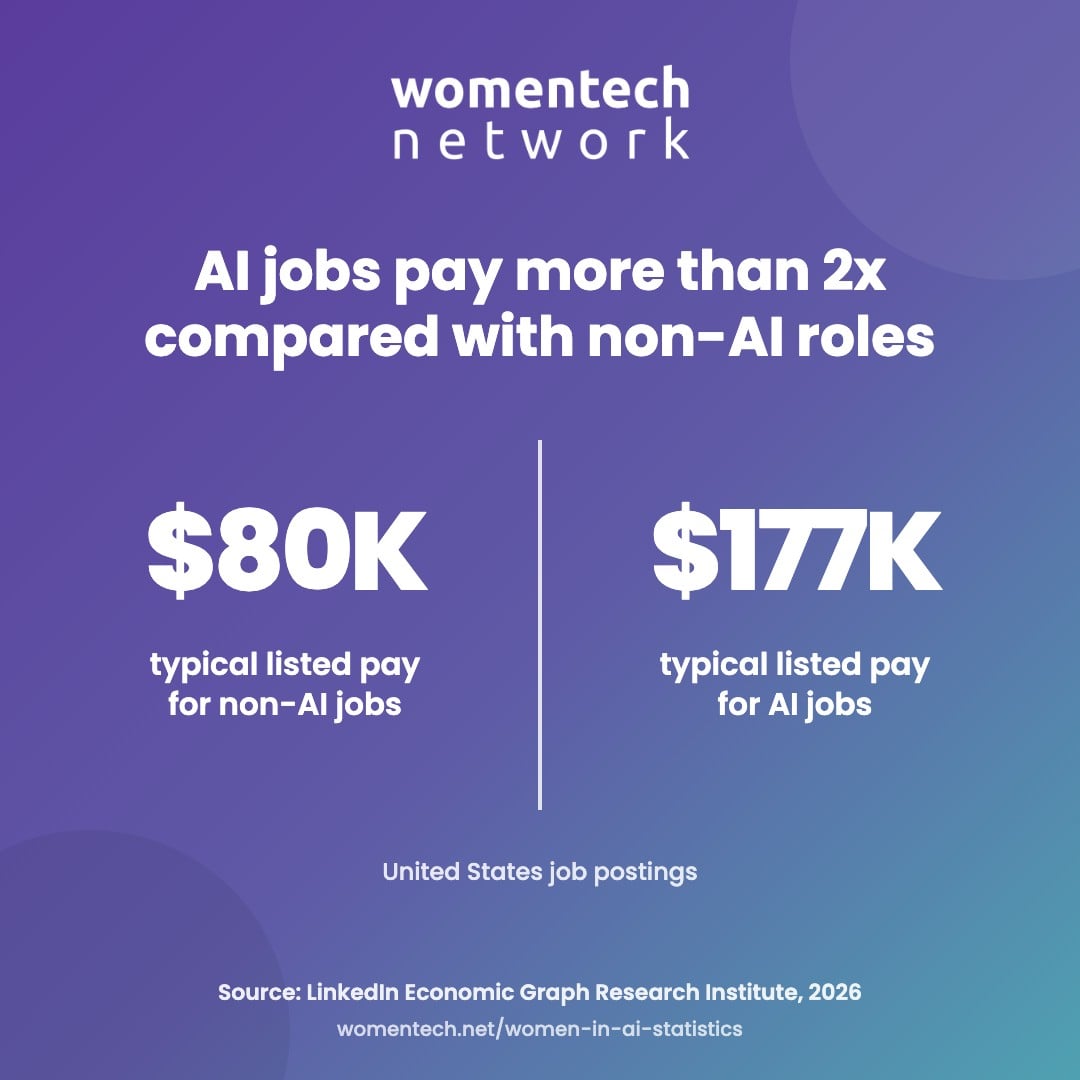
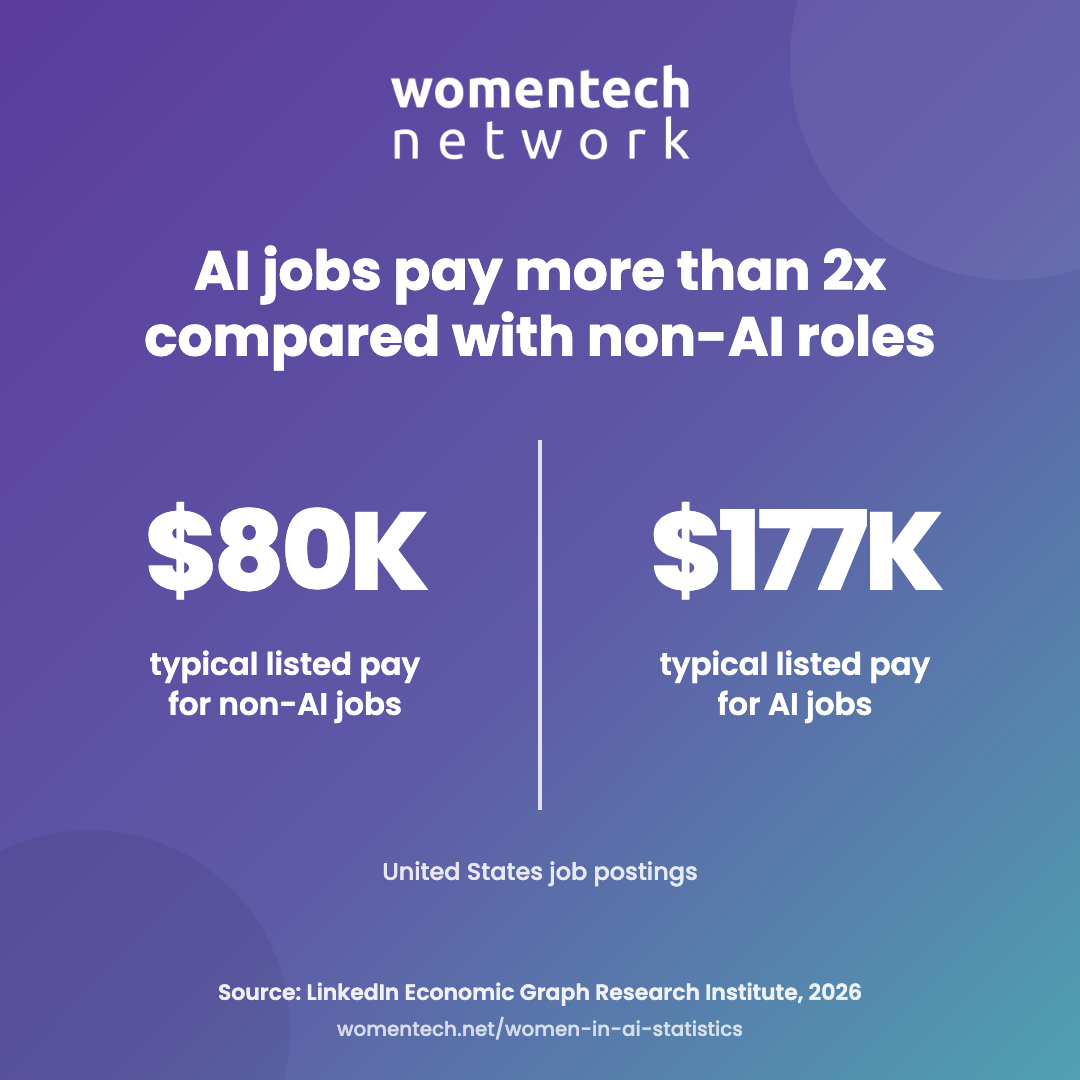
LinkedIn's typical listed compensation for a US AI job was more than twice that of a non-AI job. LinkedIn did not disaggregate this figure by gender.
US AI job postings roughly doubled between 2023 and 2026, and the typical US AI job posting listed approximately $177,000 in compensation, compared with $80,000 for the typical non-AI role (LinkedIn Economic Graph Research Institute, 2026). PwC’s 2026 AI Jobs Barometer adds that jobs “professionalised” by AI carry 42% higher wage growth since 2021 and grow twice as fast as jobs “democratised” by it; AI skills appeared in 2.56% of all US job postings in 2025.
Women reach those jobs less often: one in four US AI hires in 2025, as shown above, and a Member of Technical Staff share that slipped from 23% in 2021 to 19% by May 2026. Across AI occupations, a 10 percentage-point rise in the male share went with about $45,000 higher median listed pay, a pattern across occupations rather than a comparison of women and men in the same job. The LinkedIn report did not disaggregate listed compensation by gender. A related workplace measure is recognition: 23% of men and 18% of women who used AI at work had been praised for it (Lean In, 2026).
Whether AI skills have brought recognition, a promotion or a raise, and whether AI roles are rewarded and promoted fairly across gender, are asked in the State of Women in AI 2026 study, precisely because no public dataset answers them.

By country
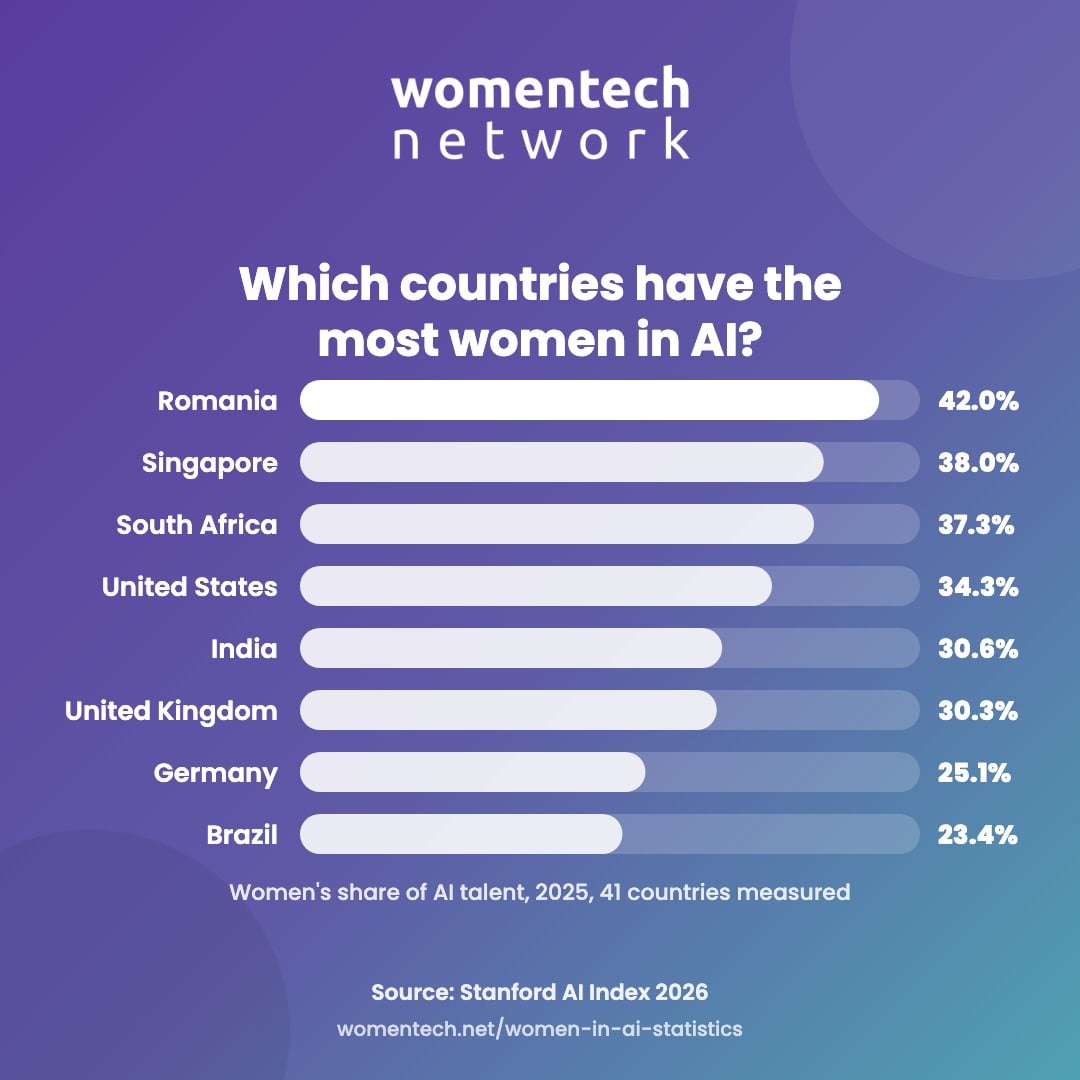
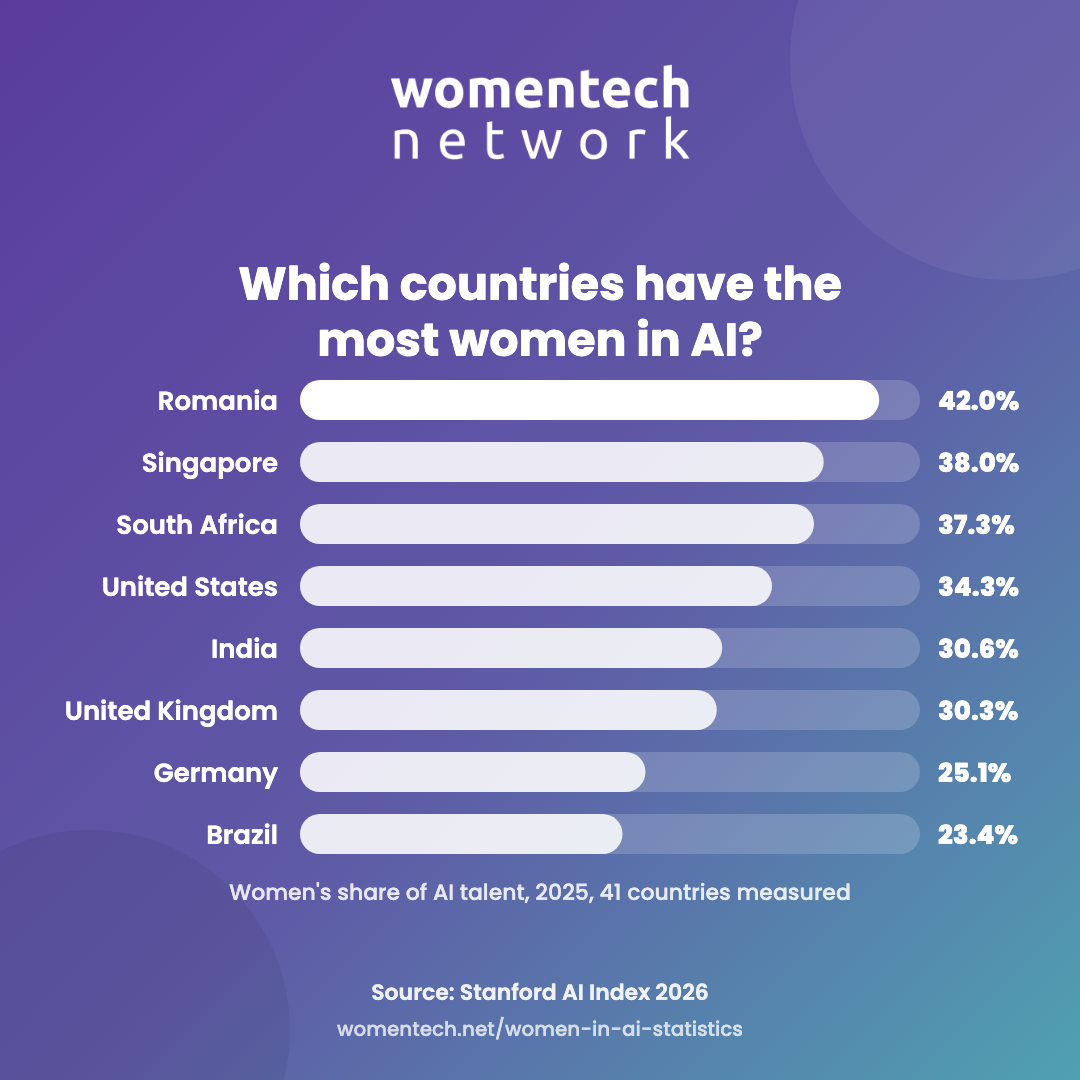
Where do women hold the largest share of AI talent?
Romania, Singapore and South Africa lead 41 countries; Germany and Brazil trail.
Using 2025 LinkedIn data, the Stanford AI Index 2026 puts women’s share of AI talent at 42.04% in Romania, 38.01% in Singapore, 37.31% in South Africa and 35.48% in Italy. The United States (34.26%) follows; France (31.02%), India (30.64%) and the United Kingdom (30.25%) cluster around the global figure of 30.54%; Israel (26.41%), Germany (25.08%) and Brazil (23.41%) close the list.
Across the set, men remain 65% to 75% of AI talent and the ratios have hardly changed since 2016. Learning data tell a more varied story: women were 49.7% of Coursera GenAI enrollments in Uzbekistan and 47.7% in Ecuador, but 15.9% in Pakistan and 22.2% in Egypt.
Beyond LinkedIn profiles, country-level evidence thins out fast. The State of Women in AI 2026 study is global, so Europe, the UK, India and Africa can be reported with the same depth as the United States.

Agentic AI
Who is measuring women in the age of AI agents?
Budgets, strategies and benchmarks for AI agents are all being counted. Women are not, yet.
The enterprise numbers are clear: 88% of senior executives plan to increase AI budgets because of agentic AI (PwC, 300 executives, May 2025), 81% of leaders expect agents in their AI strategy within 12 to 18 months and 46% already use agents to fully automate workflows (Microsoft Work Trend Index 2025, 31,000 knowledge workers in 31 markets). Deloitte expects 25% of GenAI-using companies to run agentic pilots in 2025 and 50% by 2027.
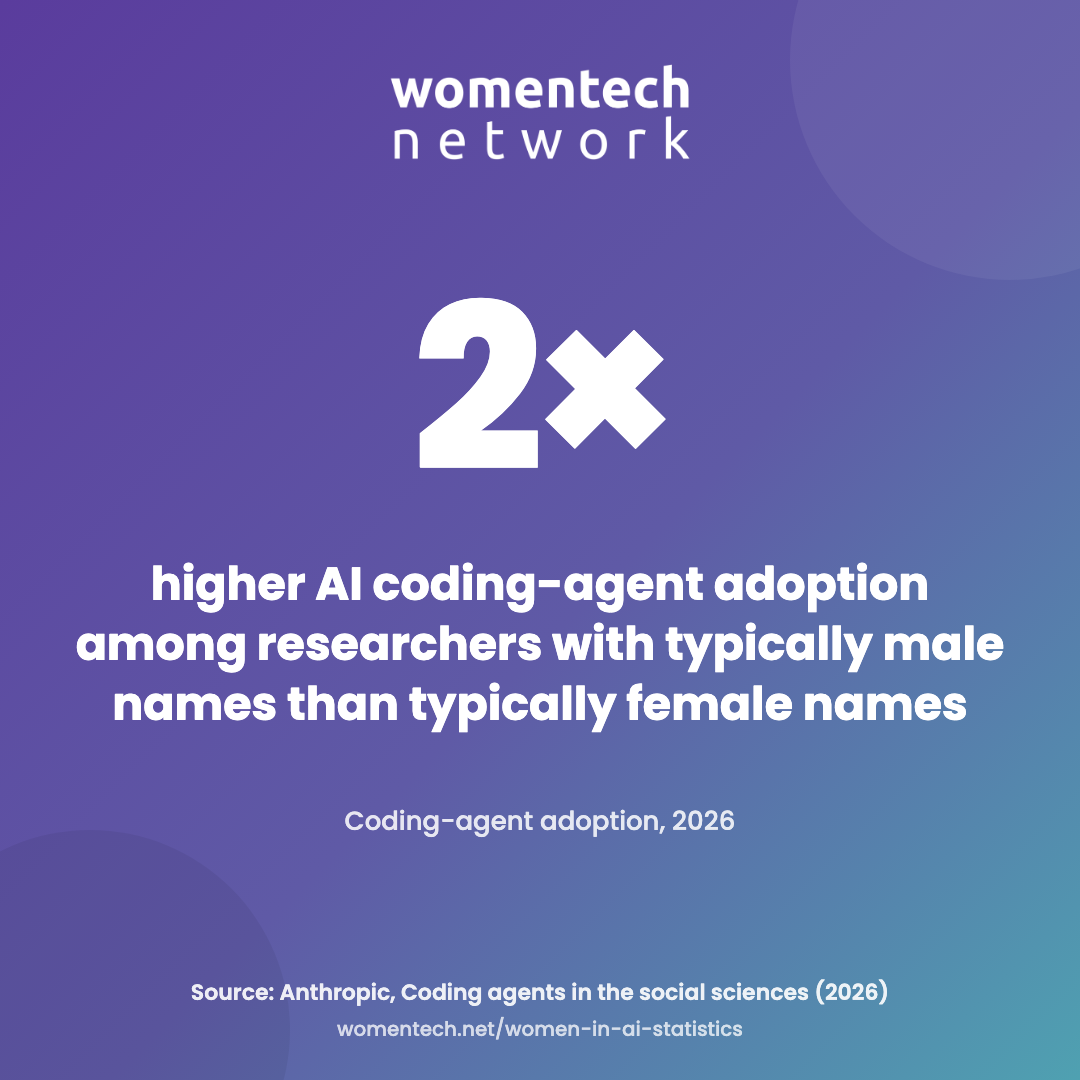
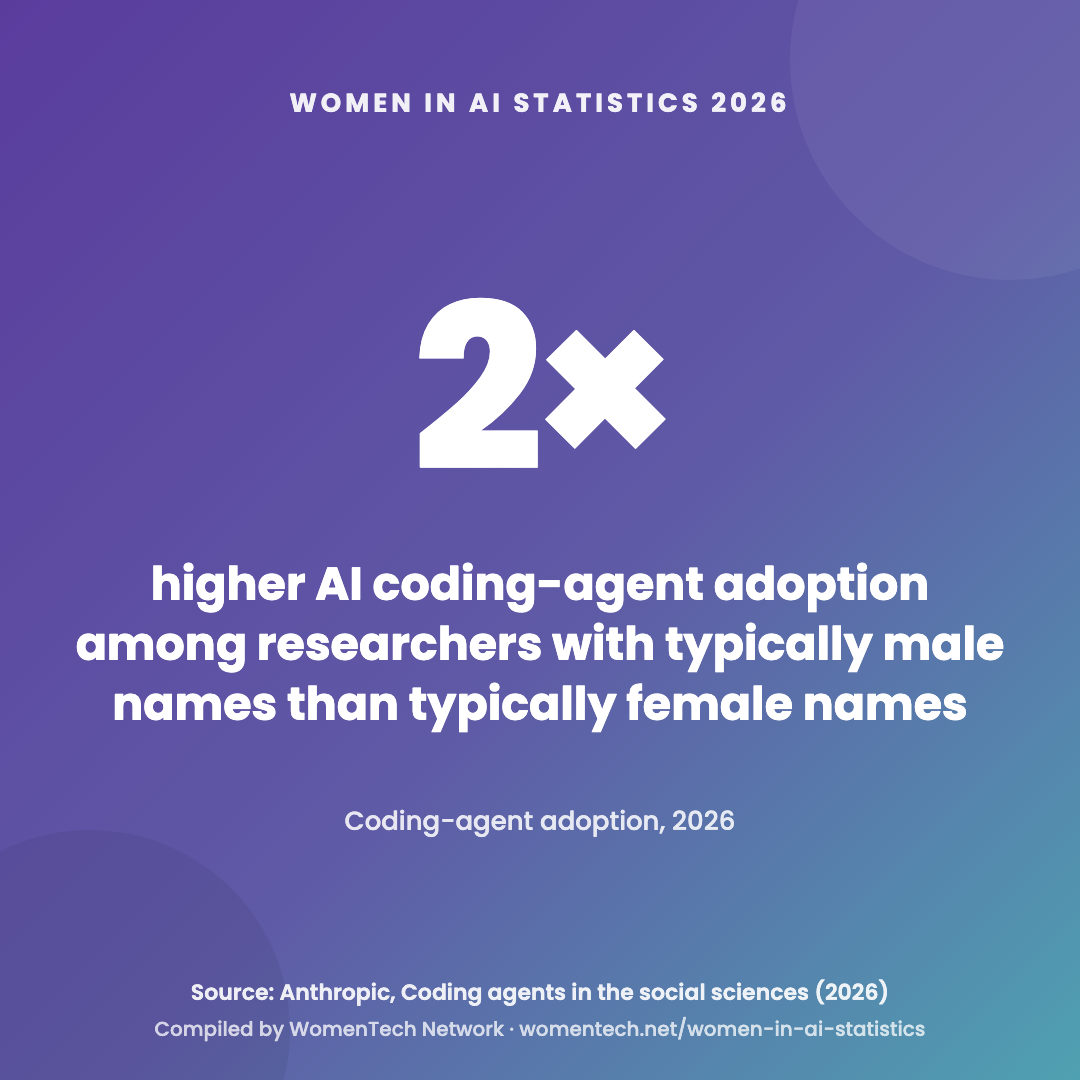
Capability is moving as fast: Stanford’s AI Index 2026 puts agent success on the OSWorld computer-task benchmark at about 66%, up from 12%. None of these sources breaks results down by gender. The single gender-disaggregated datapoint comes from Anthropic’s 2026 survey of 1,260 quantitative social scientists, and it points to a wide gap.
This is why WomenTech Network and Women AI Builders are running the State of Women in AI 2026 study: it asks women how they work with AI agents today, what they use them for and how prepared they feel, the gender-disaggregated evidence the agentic era is currently missing.

Full data set
Explore all 200+ data points
Filter by topic, geography or source, copy any single finding with its source, open the original research, or download all 204 rows as CSV.
| ID | Topic | Finding | Scope & year | Source | Copy |
|---|---|---|---|---|---|
| #001 | Roles & leadership | Women were 22% and men 78% of AI professionals identified through LinkedIn. | Global, published 2018 | WEF/LinkedIn | |
| #002 | Roles & leadership | Women accounted for about 30% of the global AI workforce. | Global, 2022; ILO report published 2026 | ILO | |
| #003 | Roles & leadership | Women were 23% of the US AI talent pool in the original benchmark. | US, published 2018 | WEF/LinkedIn | |
| #004 | Roles & leadership | Women were 16% of Germany's AI talent pool. | Germany, published 2018 | WEF/LinkedIn | |
| #005 | Roles & leadership | Women were 17% of Argentina's AI talent pool. | Argentina, published 2018 | WEF/LinkedIn | |
| #006 | Roles & leadership | Women averaged 28%, versus 72% men, in the AI talent pools of Italy, Singapore and South Africa. | Three-country average, published 2018 | WEF/LinkedIn | |
| #007 | Roles & leadership | Women's share of AI talent oscillated between 21% and 23% over the four years studied. | Global LinkedIn trend, published 2018 | WEF/LinkedIn | |
| #008 | Roles & leadership | Software and IT services employed 40% of the AI talent pool. | Global LinkedIn pool, published 2018 | WEF/LinkedIn | |
| #009 | Roles & leadership | Education employed 19% of the AI talent pool. | Global LinkedIn pool, published 2018 | WEF/LinkedIn | |
| #010 | Roles & leadership | Women working in software and IT services made up 7.4% of the total AI talent pool. | Global LinkedIn pool, published 2018 | WEF/LinkedIn | |
| #011 | Roles & leadership | Women working in education made up 4.6% of the total AI talent pool. | Global LinkedIn pool, published 2018 | WEF/LinkedIn | |
| #012 | Roles & leadership | Nonprofits employed 4% of the AI talent pool. | Global LinkedIn pool, published 2018 | WEF/LinkedIn | |
| #013 | Roles & leadership | Healthcare employed 2% of the AI talent pool. | Global LinkedIn pool, published 2018 | WEF/LinkedIn | |
| #014 | Roles & leadership | 40% of women in the female AI pool listed machine-learning skills, compared with 47% of men in the male pool. | Global LinkedIn pool, published 2018 | WEF/LinkedIn | |
| #015 | Roles & leadership | Data analysts were 4.2% of the female AI pool and 3.0% of the male AI pool. | Global LinkedIn pool, published 2018 | WEF/LinkedIn | |
| #016 | Roles & leadership | Women were 30.54% and men 69.46% of global LinkedIn AI talent. | Global, 2024 | Stanford AI Index 2025 | |
| #017 | Roles & leadership | Women were 34.3% and men 65.7% of US LinkedIn AI talent. | US, 2025 | Stanford AI Index 2026 | |
| #018 | Roles & leadership | Men generally represented 65% to 75% of AI talent across the countries Stanford measured. | Selected countries, 2025 | Stanford AI Index 2026 | |
| #019 | Roles & leadership | Women were 30% of AI talent. | Global, 2022 | WEF/LinkedIn | |
| #020 | Roles & leadership | The concentration of AI talent grew sixfold from 2016 to 2022. | Global LinkedIn data, 2016-2022 | WEF/LinkedIn | |
| #021 | Roles & leadership | Women were 28% of AI talent in financial services. | Global LinkedIn industry data, 2022 | WEF/LinkedIn | |
| #022 | Roles & leadership | Women were 40% of AI talent in education. | Global LinkedIn industry data, 2022 | WEF/LinkedIn | |
| #023 | Roles & leadership | Women were 31% of AI talent in professional services. | Global LinkedIn industry data, 2022 | WEF/LinkedIn | |
| #024 | Roles & leadership | Women were 25% of AI talent in technology, information and media. | Global LinkedIn industry data, 2022 | WEF/LinkedIn | |
| #025 | Roles & leadership | Women were 38% of AI talent in consumer services. | Global LinkedIn industry data, 2022 | WEF/LinkedIn | |
| #026 | Roles & leadership | Women were 35% of AI talent in government and the public sector. | Global LinkedIn industry data, 2022 | WEF/LinkedIn | |
| #027 | Roles & leadership | Women's share of AI talent rose about 4 percentage points, from roughly 26% in 2016 to 30% in 2022. | Global LinkedIn data, 2016-2022 | WEF/LinkedIn | |
| #028 | Roles & leadership | Women averaged 35% of the modeled AI workforce across the OECD-country sample. | Selected OECD countries, 2018-2019; US through 2020 | OECD working paper | |
| #029 | Roles & leadership | Women's modeled share ranged from 30% in the Netherlands to 46% in Latvia. | Selected OECD countries, 2018-2019; US through 2020 | OECD working paper | |
| #030 | Roles & leadership | An earlier US study cited by OECD estimated women at 36% of the US AI workforce. | US, cited in OECD 2023 | OECD working paper | |
| #031 | Roles & leadership | The modeled AI workforce represented 0.34% of employment across the OECD sample. | Selected OECD countries, 2019 | OECD working paper | |
| #032 | Roles & leadership | The modeled AI workforce grew from 0.07% to 0.34% of employment from 2011 to 2019. | Selected OECD countries, 2011-2019 | OECD working paper | |
| #033 | Roles & leadership | More than 60% of the modeled AI workforce had at least a tertiary degree. | Selected OECD countries, pooled data | OECD working paper | |
| #034 | Roles & leadership | Almost 50% of the modeled AI workforce earned above the 80th percentile. | Selected OECD countries, pooled data | OECD working paper | |
| #035 | Roles & leadership | Women were 20% of employees in technical roles at major machine-learning companies. | Global, multiple years | UNESCO | |
| #036 | Roles & leadership | Women were 12% of AI researchers. | Global, earlier estimate | UNESCO | |
| #037 | Roles & leadership | Women were 6% of professional software developers in UNESCO's displayed figure. | Global, multiple years · software overall, context figure, not AI-specific | UNESCO | |
| #038 | Roles & leadership | Women held 14% of AI executive roles. | Global, published 2026 | IMD | |
| #039 | Roles & leadership | Women's share of new AI PhDs rose 3.2 percentage points from 2011 to 2021. | North America, 2011-2021 | Stanford AI Index 2023 | |
| #040 | Roles & leadership | Women's share of new CS, CE and information faculty hires rose from 24.9% in 2017 to 30.2% in 2021. | North American universities | Stanford AI Index 2023 | |
| #041 | Roles & leadership | Men were 75.9% of CS, CE and information faculty. | North American universities, 2021 | Stanford AI Index 2023 | |
| #042 | Roles & leadership | 0.1% of CS, CE and information faculty identified as nonbinary. | North American universities, 2021 | Stanford AI Index 2023 | |
| #043 | Adoption & attitudes | In 2024, 33% of US adults, 39% of men and 28% of women had used an AI chatbot. | US adults, 2024 | Pew Research Center | |
| #044 | Adoption & attitudes | In 2026, 49% of US adults, 50% of men and 47% of women said they ever used an AI chatbot. | US adults, 2026 | Pew Research Center | |
| #045 | Adoption & attitudes | Women's reported chatbot use rose 19 percentage points from 2024 to 2026; men's rose 11 points. | US adults, calculated from Pew values | Pew Research Center | |
| #046 | Adoption & attitudes | 27% of men and 20% of women used AI chatbots daily. | US adults, 2026 | Pew Research Center | |
| #047 | Adoption & attitudes | 29% of men and 20% of women had used Gemini. | US adults, 2026 | Pew Research Center | |
| #048 | Adoption & attitudes | 22% of men and 13% of women had used Copilot. | US adults, 2026 | Pew Research Center | |
| #049 | Adoption & attitudes | 11% of men and 4% of women had used Grok. | US adults, 2026 | Pew Research Center | |
| #050 | Adoption & attitudes | 9% of men and 4% of women had used Claude. | US adults, 2026 | Pew Research Center | |
| #051 | Adoption & attitudes | 4% of men and 2% of women had used Character.ai. | US adults, 2026 | Pew Research Center | |
| #052 | Adoption & attitudes | ChatGPT use was equal at 44% of men and 44% of women. | US adults, 2026 | Pew Research Center | |
| #053 | Adoption & attitudes | 13% of men and 15% of women had used Meta AI. | US adults, 2026 | Pew Research Center | |
| #054 | Adoption & attitudes | 45% of men and 39% of women used chatbots to search for information. | US adults, 2026 | Pew Research Center | |
| #055 | Adoption & attitudes | 28% of men and 22% of women used chatbots for fun or entertainment. | US adults, 2026 | Pew Research Center | |
| #056 | Adoption & attitudes | Among employed adults, 40% of men and 35% of women used chatbots for work tasks. | Employed US adults, 2026 | Pew Research Center | |
| #057 | Adoption & attitudes | 24% of men and 23% of women used chatbots to create or edit images or videos. | US adults, 2026 | Pew Research Center | |
| #058 | Adoption & attitudes | 21% of men and 19% of women used chatbots for medical advice. | US adults, 2026 | Pew Research Center | |
| #059 | Adoption & attitudes | 20% of men and 19% of women used chatbots for diet or fitness information. | US adults, 2026 | Pew Research Center | |
| #060 | Adoption & attitudes | 15% of men and 12% of women used chatbots to get news. | US adults, 2026 | Pew Research Center | |
| #061 | Adoption & attitudes | 8% of men and 11% of women used chatbots for emotional support or advice. | US adults, 2026 | Pew Research Center | |
| #062 | Adoption & attitudes | 4% of men and 4% of women used chatbots for companionship. | US adults, 2026 | Pew Research Center | |
| #063 | Adoption & attitudes | 35% of men and 25% of women said chatbots helped their productivity at least a little. | US adults, 2026 | Pew Research Center | |
| #064 | Adoption & attitudes | 30% of men and 26% of women said chatbots helped how informed they were. | US adults, 2026 | Pew Research Center | |
| #065 | Adoption & attitudes | 23% of men and 19% of women said chatbots helped their creativity. | US adults, 2026 | Pew Research Center | |
| #066 | Adoption & attitudes | 9% of men and 7% of women said chatbots helped their happiness. | US adults, 2026 | Pew Research Center | |
| #067 | Adoption & attitudes | 6% of men and 6% of women said chatbots helped their relationships. | US adults, 2026 | Pew Research Center | |
| #068 | Adoption & attitudes | 63% of men and 57% of women said they read AI summaries at the top of search results. | US adults, 2026 | Pew Research Center | |
| #069 | Adoption & attitudes | For AI's personal impact over 20 years, US adults answered 23% positive, 31% negative, 27% mixed and 19% unsure. | US adults, 2026 | Pew Research Center | |
| #070 | Adoption & attitudes | Men's views of AI's personal impact were 29% positive, 27% negative, 27% mixed and 16% unsure. | US men, 2026 | Pew Research Center | |
| #071 | Adoption & attitudes | Women's views of AI's personal impact were 17% positive, 33% negative, 27% mixed and 22% unsure. | US women, 2026 | Pew Research Center | |
| #072 | Adoption & attitudes | For AI's societal impact, US adults answered 16% positive, 40% negative, 31% mixed and 13% unsure. | US adults, 2026 | Pew Research Center | |
| #073 | Adoption & attitudes | Men's views of AI's societal impact were 22% positive, 36% negative, 30% mixed and 12% unsure. | US men, 2026 | Pew Research Center | |
| #074 | Adoption & attitudes | Women's views of AI's societal impact were 11% positive, 43% negative, 31% mixed and 15% unsure. | US women, 2026 | Pew Research Center | |
| #075 | Adoption & attitudes | On development speed, US adults answered 63% too quickly, 19% right pace, 2% too slowly and 16% unsure. | US adults, 2026 | Pew Research Center | |
| #076 | Adoption & attitudes | Men answered 58% too quickly, 23% right pace, 3% too slowly and 15% unsure. | US men, 2026 | Pew Research Center | |
| #077 | Adoption & attitudes | Women answered 68% too quickly, 14% right pace, 1% too slowly and 17% unsure. | US women, 2026 | Pew Research Center | |
| #078 | Adoption & attitudes | 55% of men and 41% of women said they had heard a lot about AI. | US adults, 2026 | Pew Research Center | |
| #079 | Adoption & attitudes | 48% of men and 38% of women said they had heard a lot about AI chatbots. | US adults, 2026 | Pew Research Center | |
| #080 | Adoption & attitudes | 22% of men and 15% of women felt extremely or very confident using chatbots. | US adults, 2026 | Pew Research Center | |
| #081 | Workplace use | 33% of men and 27% of women used AI daily or constantly at work, a six-percentage-point gap. | US adults, 2026 | Lean In | |
| #082 | Workplace use | 78% of men and 73% of women had ever used AI at work, a five-percentage-point gap. | US adults, 2026 | Lean In | |
| #083 | Workplace use | 45% of men and 40% of women felt positive about AI, a five-percentage-point gap. | US adults, 2026 | Lean In | |
| #084 | Workplace use | 26% of men and 20% of women felt energized about AI, a six-percentage-point gap. | US adults, 2026 | Lean In | |
| #085 | Workplace use | 25% of women and 20% of men felt threatened by AI, a five-percentage-point gap. | US adults, 2026 | Lean In | |
| #086 | Workplace use | 29% of women and 22% of men worried AI use would be perceived as cheating, a seven-percentage-point gap. | US adults, 2026 | Lean In | |
| #087 | Workplace use | 19% of women and 8% of men predicted more women than men would be laid off because of AI. | US adults, 2026 | Lean In | |
| #088 | Workplace use | 22% of women and 17% of men questioned AI accuracy, a five-percentage-point gap. | US adults, 2026 | Lean In | |
| #089 | Workplace use | 22% of women and 16% of men had ethical reservations about AI, a six-percentage-point gap. | US adults, 2026 | Lean In | |
| #090 | Workplace use | Among workers who had used AI, 23% of men and 18% of women had been praised for it, a five-percentage-point gap. | US AI users at work, 2026 | Lean In | |
| #091 | Workplace use | 37% of men and 30% of women were encouraged by a manager to use AI, a seven-percentage-point gap. | US adults, 2026 | Lean In | |
| #092 | Workplace use | 57% of respondents used GenAI for at least one personal purpose. | US adults, 2025 · overall population, not gender-split (context) | Brookings/NORC | |
| #093 | Workplace use | Among personal GenAI users, 74% used it for internet searches or web browsing. | US personal GenAI users, 2025 · overall population, not gender-split (context) | Brookings/NORC | |
| #094 | Workplace use | Personal GenAI use was 67% among respondents with a bachelor's degree or more. | US adults, 2025 · overall population, not gender-split (context) | Brookings/NORC | |
| #095 | Workplace use | Personal GenAI use was 60% among respondents with some college or an associate degree. | US adults, 2025 · overall population, not gender-split (context) | Brookings/NORC | |
| #096 | Workplace use | Personal GenAI use was 46% among high-school graduates. | US adults, 2025 · overall population, not gender-split (context) | Brookings/NORC | |
| #097 | Workplace use | Daily-or-more personal AI use was 20% among respondents with a bachelor's degree or more. | US adults, 2025 · overall population, not gender-split (context) | Brookings/NORC | |
| #098 | Workplace use | Daily-or-more personal AI use was 21% among respondents with some college or an associate degree. | US adults, 2025 · overall population, not gender-split (context) | Brookings/NORC | |
| #099 | Workplace use | Daily-or-more personal AI use was 8% for high-school graduates and 8% for respondents without a diploma. | US adults, 2025 · overall population, not gender-split (context) | Brookings/NORC | |
| #100 | Workplace use | 40% said their AI use had increased at least slightly over the prior year. | US adults, 2025 · overall population, not gender-split (context) | Brookings/NORC | |
| #101 | Workplace use | 4% said their AI use had decreased over the prior year. | US adults, 2025 · overall population, not gender-split (context) | Brookings/NORC | |
| #102 | Workplace use | 11% of adults ages 18-29 said they used AI less frequently than a year earlier. | US adults ages 18-29, 2025 · overall population, not gender-split (context) | Brookings/NORC | |
| #103 | Workplace use | 55% of respondents with a bachelor's degree or more reported increased AI use. | US adults, 2025 · overall population, not gender-split (context) | Brookings/NORC | |
| #104 | Workplace use | Increased AI use was 24% without a high-school diploma and 27% among high-school graduates. | US adults, 2025 · overall population, not gender-split (context) | Brookings/NORC | |
| #105 | Workplace use | 21% used GenAI in their professional role. | US adults, 2025 · overall population, not gender-split (context) | Brookings/NORC | |
| #106 | Workplace use | Professional GenAI use was 25% among men and 17% among women. | US adults, 2025 | Brookings/NORC | |
| #107 | Workplace use | Professional GenAI use was 33% among respondents with a bachelor's degree or more. | US adults, 2025 · overall population, not gender-split (context) | Brookings/NORC | |
| #108 | Workplace use | Professional GenAI use was 20% among respondents with some college or an associate degree. | US adults, 2025 · overall population, not gender-split (context) | Brookings/NORC | |
| #109 | Workplace use | Professional GenAI use was 12% among high-school graduates. | US adults, 2025 · overall population, not gender-split (context) | Brookings/NORC | |
| #110 | Workplace use | Professional GenAI use was 5% among respondents without a high-school diploma. | US adults, 2025 · overall population, not gender-split (context) | Brookings/NORC | |
| #111 | Workplace use | Professional GenAI use peaked at 31% among adults ages 30-44. | US adults, 2025 · overall population, not gender-split (context) | Brookings/NORC | |
| #112 | Workplace use | Professional GenAI use was 26% among adults ages 45-59. | US adults, 2025 · overall population, not gender-split (context) | Brookings/NORC | |
| #113 | Workplace use | Professional GenAI use was 25% among adults ages 18-29. | US adults, 2025 · overall population, not gender-split (context) | Brookings/NORC | |
| #114 | Workplace use | Professional GenAI use was 8% among adults ages 60 and older. | US adults, 2025 · overall population, not gender-split (context) | Brookings/NORC | |
| #115 | Workplace use | Professional GenAI use was 9% below $30,000 household income and 34% at $100,000 or more. | US adults, 2025 · overall population, not gender-split (context) | Brookings/NORC | |
| #116 | Workplace use | 22% said AI use in their workplace had increased in the prior six months. | US adults, 2025 · overall population, not gender-split (context) | Brookings/NORC | |
| #117 | Workplace use | Increased workplace AI use was 40% for BA+, 19% for some college, 9% for high-school graduates and 5% without a diploma. | US adults, 2025 · overall population, not gender-split (context) | Brookings/NORC | |
| #118 | Workplace use | 19% said AI increased their daily productivity. | US adults, 2025 · overall population, not gender-split (context) | Brookings/NORC | |
| #119 | Workplace use | 4% said AI increased their productivity significantly. | US adults, 2025 · overall population, not gender-split (context) | Brookings/NORC | |
| #120 | Workplace use | 22% said their daily productivity remained the same. | US adults, 2025 · overall population, not gender-split (context) | Brookings/NORC | |
| #121 | Workplace use | 53% were unsure about AI's productivity effect or said it did not apply. | US adults, 2025 · overall population, not gender-split (context) | Brookings/NORC | |
| #122 | Workplace use | 11% expected AI to increase job opportunities in their field over five years. | US adults, 2025 · overall population, not gender-split (context) | Brookings/NORC | |
| #123 | Workplace use | 53% of the healthcare-professional subsample reported using AI. | US healthcare subsample, 2025 · overall population, not gender-split (context) | Brookings/NORC | |
| #124 | Workplace use | 25% of the healthcare subsample cited patient-communication tools. | US healthcare subsample, 2025 · overall population, not gender-split (context) | Brookings/NORC | |
| #125 | Workplace use | AI use was 82% among male and 40% among female healthcare professionals in the sample. | US healthcare subsample, 2025 | Brookings/NORC | |
| #126 | Workplace use | AI use was 79% among men and 39% among women in the finance subsample; Brookings cautions that it contained fewer than 50 respondents. | US finance subsample, 2025 | Brookings/NORC | |
| #127 | Workplace use | Professional GenAI use was 29% among small-business respondents and 27% among larger-firm respondents. | Employed US respondents, 2025 · overall population, not gender-split (context) | Brookings/NORC | |
| #128 | Workplace use | Increased workplace AI use was 59% at small businesses and 60% at larger firms. | Employed US respondents, 2025 | Brookings/NORC | |
| #129 | Exposure & transition | More than 30% of workers were in occupations where GenAI could affect at least half of tasks. | US workforce exposure analysis, 2024 · overall population, not gender-split (context) | Brookings | |
| #130 | Exposure & transition | About 85% of workers were in occupations where GenAI could affect at least 10% of tasks. | US workforce exposure analysis, 2024 | Brookings | |
| #131 | Exposure & transition | Nearly 19 million Americans worked in office and administrative support occupations highlighted for high exposure and automation potential. | US workforce, 2024 analysis | Brookings | |
| #132 | Exposure & transition | 36% of women workers and 25% of men were in occupations where GenAI could save at least half the time on tasks. | US workforce exposure analysis, 2024 | Brookings | |
| #133 | Exposure & transition | 37.1 million workers were in the top quartile of occupational AI exposure. | US workforce sample, 2026 analysis | Brookings | |
| #134 | Exposure & transition | 26.5 million highly exposed workers also had above-median adaptive capacity. | US workforce sample, 2026 analysis | Brookings | |
| #135 | Exposure & transition | About 70% of highly exposed workers had high average capacity to manage a job transition. | US workforce sample, 2026 analysis | Brookings | |
| #136 | Exposure & transition | 6.1 million workers combined high AI exposure with low adaptive capacity. | US workforce sample, 2026 analysis | Brookings | |
| #137 | Exposure & transition | The high-exposure, low-capacity group was 4.2% of the workforce sample. | US workforce sample, 2026 analysis | Brookings | |
| #138 | Exposure & transition | Women were 86% of the high-exposure, low-adaptive-capacity group. | US workforce sample, 2026 analysis | Brookings | |
| #139 | Exposure & transition | GenAI exposure was 29% for female-dominated occupations and 16% for male-dominated occupations. | 84 countries, published 2026 | ILO research brief | |
| #140 | Exposure & transition | In the highest exposure categories, the shares were 16% for female-dominated and 3% for male-dominated occupations. | Countries with available data, published 2026 | ILO | |
| #141 | Exposure & transition | Women were more exposed to GenAI than men in 88% of countries analyzed. | 84-country analysis, published 2026 | ILO | |
| #142 | Exposure & transition | More than 40% of women's employment was exposed to GenAI in several economies, including Switzerland, the UK and the Philippines. | Selected economies, published 2026 | ILO | |
| #143 | Exposure & transition | Job exposure was 41% in high-income countries and 11% in low-income countries. | Country income groups, published 2026 | ILO | |
| #144 | Jobs & demand | Data scientist employment is projected to grow 33.5%, adding 82,500 jobs. | US, 2024-2034 projection | US BLS | |
| #145 | Jobs & demand | Information security analyst employment is projected to grow 28.5%, adding 52,100 jobs. | US, 2024-2034 projection | US BLS | |
| #146 | Jobs & demand | Actuary employment is projected to grow 21.8%, adding 7,300 jobs. | US, 2024-2034 projection | US BLS | |
| #147 | Jobs & demand | Operations research analyst employment is projected to grow 21.5%, adding 24,100 jobs. | US, 2024-2034 projection | US BLS | |
| #148 | Jobs & demand | Computer and information research scientist employment is projected to grow 19.7%, adding 7,900 jobs. | US, 2024-2034 projection | US BLS | |
| #149 | Jobs & demand | Software developer employment is projected to grow 15.8%, adding 267,700 jobs. | US, 2024-2034 projection | US BLS | |
| #150 | Jobs & demand | Medical records specialist employment is projected to grow 7.1%, adding 13,800 jobs. | US, 2024-2034 projection | US BLS | |
| #151 | Jobs & demand | Sales engineer employment is projected to grow 5.5%, adding 3,100 jobs. | US, 2024-2034 projection | US BLS | |
| #152 | Jobs & demand | Medical secretary and administrative assistant employment is projected to grow 4.2%, adding 35,300 jobs. | US, 2024-2034 projection | US BLS | |
| #153 | Jobs & demand | Total US employment is projected to grow 3.1%, adding 5,211,800 jobs. | US, 2024-2034 projection | US BLS | |
| #154 | Jobs & demand | Executive secretary and executive administrative assistant employment is projected to fall 1.6%, a decline of 7,900 jobs. | US, 2024-2034 projection | US BLS | |
| #155 | Jobs & demand | Other secretary and administrative assistant employment is projected to fall 1.6%, a decline of 30,800 jobs. | US, 2024-2034 projection | US BLS | |
| #156 | Jobs & demand | Medical transcriptionist employment is projected to fall 4.9%, a decline of 2,200 jobs. | US, 2024-2034 projection | US BLS | |
| #157 | Jobs & demand | Claims adjuster, examiner and investigator employment is projected to fall 5.1%, a decline of 18,200 jobs. | US, 2024-2034 projection | US BLS | |
| #158 | Jobs & demand | Broadcast announcer and radio DJ employment is projected to fall 5.5%, a decline of 1,300 jobs. | US, 2024-2034 projection | US BLS | |
| #159 | Jobs & demand | Customer service representative employment is projected to fall 5.5%, a decline of 153,700 jobs. | US, 2024-2034 projection | US BLS | |
| #160 | Jobs & demand | Legal secretary and administrative assistant employment is projected to fall 5.8%, a decline of 9,000 jobs. | US, 2024-2034 projection | US BLS | |
| #161 | Jobs & demand | Credit authorizer, checker and clerk employment is projected to fall 6.2%, a decline of 700 jobs. | US, 2024-2034 projection | US BLS | |
| #162 | Jobs & demand | Procurement clerk employment is projected to fall 8.7%, a decline of 5,400 jobs. | US, 2024-2034 projection | US BLS | |
| #163 | Jobs & demand | AI postings were 2.56% of all US job postings. | US, 2025 | Stanford AI Index 2026 | |
| #164 | Jobs & demand | Broad AI skills appeared in 1.70% of all US job postings. | US, 2025 | Stanford AI Index 2026 | |
| #165 | Jobs & demand | Machine-learning skills appeared in 0.99% of all US job postings. | US, 2025 | Stanford AI Index 2026 | |
| #166 | Jobs & demand | Generative-AI skills appeared in 0.41% of all US job postings. | US, 2025 | Stanford AI Index 2026 | |
| #167 | Jobs & demand | AI-agent skills appeared in 0.23% of all US job postings. | US, 2025 | Stanford AI Index 2026 | |
| #168 | Jobs & demand | Natural-language-processing skills appeared in 0.22% of all US job postings. | US, 2025 | Stanford AI Index 2026 | |
| #169 | Jobs & demand | Neural-network skills appeared in 0.20% of all US job postings. | US, 2025 | Stanford AI Index 2026 | |
| #170 | Jobs & demand | Autonomous-driving skills appeared in 0.14% of all US job postings. | US, 2025 | Stanford AI Index 2026 | |
| #171 | Jobs & demand | Visual-recognition skills appeared in 0.09% of all US job postings. | US, 2025 | Stanford AI Index 2026 | |
| #172 | Jobs & demand | Robotics skills appeared in 0.08% of all US job postings. | US, 2025 | Stanford AI Index 2026 | |
| #173 | Jobs & demand | AI-governance skills appeared in 0.05% of all US job postings. | US, 2025 | Stanford AI Index 2026 | |
| #174 | Jobs & demand | AI postings reached 13.2% of information-sector postings, up from 7.8% in 2024. | US, 2024-2025 | Stanford AI Index 2026 | |
| #175 | Jobs & demand | AI postings were 6.5% of professional, scientific and technical-services postings. | US, 2025 | Stanford AI Index 2026 | |
| #176 | Jobs & demand | AI postings were 5.3% of finance and insurance postings. | US, 2025 | Stanford AI Index 2026 | |
| #177 | Jobs & demand | AI postings were 4.7% of manufacturing postings. | US, 2025 | Stanford AI Index 2026 | |
| #178 | Jobs & demand | California accounted for 17.18% of US AI job postings. | US, 2025 | Stanford AI Index 2026 | |
| #179 | Jobs & demand | Texas accounted for 8.10% of US AI job postings. | US, 2025 | Stanford AI Index 2026 | |
| #180 | Jobs & demand | New York accounted for 6.64% of US AI job postings. | US, 2025 | Stanford AI Index 2026 | |
| #181 | Jobs & demand | Washington accounted for 3.93% of US AI job postings. | US, 2025 | Stanford AI Index 2026 | |
| #182 | Jobs & demand | Mentions of GenAI skills in AI job postings grew 111% from 2024 to 2025. | US AI job postings | Stanford AI Index 2026 | |
| #183 | Jobs & demand | Python appeared in 258,674 postings, up 391% from 2013-2015 and nearly 30% from 2024. | US AI job postings, 2025 | Stanford AI Index 2026 | |
| #184 | Education & skills | Women's share of GenAI enrollments rose from 32% in 2024 to 36% in 2025. | Global Coursera learners | Coursera | |
| #185 | Education & skills | Among enterprise learners, women's share rose from 36% in 2024 to 42% in 2025. | Global Coursera enterprise learners | Coursera | |
| #186 | Education & skills | Women were 29.2% of STEM workers, compared with 49.3% of non-STEM employment. | Global LinkedIn workforce data, 2023 | WEF/LinkedIn | |
| #187 | Education & skills | Women were six times more likely to enroll in beginner-level than intermediate GenAI courses. | Coursera learners, published 2025 | Coursera playbook article | |
| #188 | Education & skills | Women were 49.7% of GenAI enrollments in Uzbekistan. | Coursera learners in Uzbekistan, published 2025 | Coursera playbook article | |
| #189 | Education & skills | Women were 47.7% of GenAI enrollments in Ecuador. | Coursera learners in Ecuador, published 2025 | Coursera playbook article | |
| #190 | Education & skills | Women were 44.9% of GenAI enrollments in the Czech Republic. | Coursera learners in Czech Republic, published 2025 | Coursera playbook article | |
| #191 | Education & skills | Women were 41.8% of GenAI enrollments in Colombia. | Coursera learners in Colombia, published 2025 | Coursera playbook article | |
| #192 | Education & skills | Women were 15.9% of GenAI enrollments in Pakistan. | Coursera learners in Pakistan, published 2025 | Coursera playbook article | |
| #193 | Education & skills | Women were 22.2% of GenAI enrollments in Egypt. | Coursera learners in Egypt, published 2025 | Coursera playbook article | |
| #194 | Education & skills | Women were 23.4% of GenAI enrollments in Israel. | Coursera learners in Israel, published 2025 | Coursera playbook article | |
| #195 | Education & skills | Women were 23.8% of GenAI enrollments in the United Arab Emirates. | Coursera learners in UAE, published 2025 | Coursera playbook article | |
| #196 | Founders & funding | US VC-backed companies with at least one woman founder raised $73.6 billion. | US, 2025 | PitchBook | |
| #197 | Founders & funding | Companies with at least one woman founder captured 27.7% of total US VC deal value. | US, 2025 | PitchBook | |
| #198 | Founders & funding | AI accounted for roughly two-thirds of VC dollars invested in US companies with at least one woman founder. | US, 2025 | PitchBook | |
| #199 | Founders & funding | More than $30 billion of that capital came from Scale AI and Anthropic alone. | US, 2025 | PitchBook | |
| #200 | Founders & funding | Exit value for this founder cohort more than doubled year over year, and the cohort reached 25% of US exit count. | US, 2025 | PitchBook | |
| #201 | Founders & funding | Aggregate valuation of US female-founded unicorns reached $481 billion. | US, 2025 | PitchBook | |
| #202 | Agentic AI | 88% of senior executives said their team or business function plans to increase AI-related budgets in the next 12 months because of agentic AI. | US senior executives, May 2025 (n=300) | PwC AI Agent Survey | |
| #203 | Agentic AI | Among companies adopting AI agents, 66% reported increased productivity. | US senior executives, May 2025 (n=300) | PwC AI Agent Survey | |
| #204 | Agentic AI | 68% of executives reported that half or fewer of their employees interact with AI agents in their everyday work. | US senior executives, May 2025 (n=300) | PwC AI Agent Survey | |
| #205 | Agentic AI | 81% of leaders expected AI agents to be moderately or extensively integrated into their company's AI strategy within 12 to 18 months. | Knowledge workers in 31 markets, February to March 2025 (n=31,000) | Microsoft Work Trend Index 2025 | |
| #206 | Agentic AI | 46% of leaders said their companies were using AI agents to fully automate workflows or processes. | Knowledge workers in 31 markets, February to March 2025 (n=31,000) | Microsoft Work Trend Index 2025 | |
| #207 | Agentic AI | 67% of leaders were familiar or extremely familiar with AI agents, compared with 40% of employees. | Knowledge workers in 31 markets, February to March 2025 (n=31,000) | Microsoft Work Trend Index 2025 | |
| #208 | Agentic AI | Deloitte predicted that 25% of companies using generative AI would launch agentic AI pilots or proofs of concept in 2025, growing to 50% in 2027. | Global enterprise prediction, published November 2024 | Deloitte TMT Predictions 2025 | |
| #209 | Agentic AI | 23% of enterprises using generative AI were exploring AI agents to a large or very large extent, and another 42% to some extent. | Enterprises using generative AI, Deloitte State of Generative AI in the Enterprise survey, 2024 | Deloitte TMT Predictions 2025 | |
| #210 | Agentic AI | AI agents' task success on the OSWorld benchmark of real computer tasks rose from 12% to about 66%, while still failing roughly one in three attempts on structured benchmarks. | Global benchmark results, published 2026 | Stanford AI Index 2026 | |
| #211 | Agentic AI | Social scientists with typically male names had adopted coding agents at more than twice the rate of respondents with typically female names. | Quantitative social scientists surveyed February to March 2026 (n=1,260), published May 2026 | Anthropic | |
| #212 | By country | Women were 30.25% and men 69.75% of AI talent in the United Kingdom. | United Kingdom, 2025 (LinkedIn data) | Stanford AI Index 2026 | |
| #213 | By country | Women were 25.08% and men 74.92% of AI talent in Germany. | Germany, 2025 (LinkedIn data) | Stanford AI Index 2026 | |
| #214 | By country | Women were 31.02% and men 68.98% of AI talent in France. | France, 2025 (LinkedIn data) | Stanford AI Index 2026 | |
| #215 | By country | Women were 35.48% and men 64.52% of AI talent in Italy. | Italy, 2025 (LinkedIn data) | Stanford AI Index 2026 | |
| #216 | By country | Women were 30.64% and men 69.36% of AI talent in India. | India, 2025 (LinkedIn data) | Stanford AI Index 2026 | |
| #217 | By country | Women were 37.31% and men 62.69% of AI talent in South Africa. | South Africa, 2025 (LinkedIn data) | Stanford AI Index 2026 | |
| #218 | By country | Women were 38.01% and men 61.99% of AI talent in Singapore. | Singapore, 2025 (LinkedIn data) | Stanford AI Index 2026 | |
| #219 | By country | Romania had the highest women's share of AI talent among the 41 countries measured, at 42.04%. | Romania, 2025 (LinkedIn data); 41-country comparison | Stanford AI Index 2026 | |
| #220 | By country | Brazil had the lowest women's share of AI talent among the 41 countries measured, at 23.41%. | Brazil, 2025 (LinkedIn data); 41-country comparison | Stanford AI Index 2026 | |
| #221 | By country | Women were 26.41% and men 73.59% of AI talent in Israel. | Israel, 2025 (LinkedIn data) | Stanford AI Index 2026 | |
| #222 | Hiring & pay | Jobs "professionalised" by AI grew twice as fast as jobs "democratised" by AI, with 42% higher wage growth since 2021. | Global, published June 2026 | PwC 2026 AI Jobs Barometer | |
| #223 | Hiring & pay | Productivity growth was 40% higher at companies most exposed to AI than at the least exposed. | Global, published June 2026 | PwC 2026 AI Jobs Barometer | |
| #224 | Hiring & pay | "Seniorised" entry-level roles grew 35% since 2019 while overall early-career postings flatlined in highly AI-exposed sectors. | Global, 2019 to 2026 | PwC 2026 AI Jobs Barometer | |
| #225 | Founders & funding | Female-founded companies' share of overall European VC deal activity trended downward year over year. | Europe, 2025 | PitchBook | |
| #226 | Founders & funding | Aggregate valuation of European female-founded unicorns reached a record high, while deal value and count declined amid fewer megadeals. | Europe, 2025 | PitchBook | |
| #227 | Roles & leadership | Women earned 17.3% of US artificial intelligence research doctorates in 2024: 51 of 295 recipients. | United States, 2024 | NSF NCSES, Survey of Earned Doctorates 2024 (NSF 25-349, Table 3-2) | |
| #228 | Jobs & demand | BLS projects a 5.5% employment decline for customer service representatives, about 153,700 jobs, in occupations affected by AI and automation. | United States, 2024-2034 projection | US Bureau of Labor Statistics, 2024-34 Employment Projections | |
| #229 | Jobs & demand | BLS projects an 8.7% employment decline for procurement clerks, about 5,400 jobs, in occupations affected by AI and automation. | United States, 2024-2034 projection | US Bureau of Labor Statistics, 2024-34 Employment Projections | |
| #230 | Jobs & demand | BLS projects a 6.2% employment decline for credit authorizers, checkers and clerks in occupations affected by AI and automation. | United States, 2024-2034 projection | US Bureau of Labor Statistics, 2024-34 Employment Projections | |
| #231 | Jobs & demand | BLS projects a 5.8% employment decline for legal secretaries and administrative assistants in occupations affected by AI and automation. | United States, 2024-2034 projection | US Bureau of Labor Statistics, 2024-34 Employment Projections | |
| #232 | Hiring & pay | Women accounted for 26% of US AI hires in 2025, compared with 50% of non-AI hires. | United States, 2025 hires | LinkedIn Economic Graph Research Institute, The Triple Penalty (2026) | |
| #233 | Hiring & pay | Women accounted for 20% of Head of AI hires. | United States, 2025 hires | LinkedIn Economic Graph Research Institute, The Triple Penalty (2026) | |
| #234 | Hiring & pay | Women accounted for 26% of Director of AI hires. | United States, 2025 hires | LinkedIn Economic Graph Research Institute, The Triple Penalty (2026) | |
| #235 | Hiring & pay | Women accounted for 18% of Member of Technical Staff hires. | United States, 2025 hires | LinkedIn Economic Graph Research Institute, The Triple Penalty (2026) | |
| #236 | Roles & leadership | Women held 13% of C-suite AI roles at AI companies across 27 countries. | 27 countries, C-suite AI roles at AI companies, published August 2026 | LinkedIn Economic Graph Research Institute, The Triple Penalty (2026) | |
| #237 | Roles & leadership | Women held 31.2% of AI leadership roles at Director level and above, compared with 38.5% of leadership roles overall. | 24 countries, Director level and above, 2025 | LinkedIn Economic Graph Research Institute, The Triple Penalty (2026) | |
| #238 | Roles & leadership | LinkedIn estimated a 15.3 percentage-point penalty associated with reaching C-suite level after accounting for other factors in its model. | 24 countries, 2025 | LinkedIn Economic Graph Research Institute, The Triple Penalty (2026) | |
| #239 | Roles & leadership | LinkedIn estimated a 9.7 percentage-point penalty associated with working in an AI role after accounting for other factors in its model. | 24 countries, 2025 | LinkedIn Economic Graph Research Institute, The Triple Penalty (2026) | |
| #240 | Roles & leadership | LinkedIn estimated a 5.2 percentage-point penalty associated with working at an AI company after accounting for other factors in its model. | 24 countries, 2025 | LinkedIn Economic Graph Research Institute, The Triple Penalty (2026) | |
| #241 | Hiring & pay | Women’s share of Member of Technical Staff roles fell from 23% in 2021 to 19% in May 2026. | United States, 2021 to May 2026 | LinkedIn Economic Graph Research Institute, The Triple Penalty (2026) | |
| #242 | Hiring & pay | Across US AI occupations, a 10 percentage-point increase in the male share was associated with about $45,000 higher median listed pay. This cross-occupation relationship is not an individual gender pay-gap estimate. | United States, AI occupations, published August 2026 | LinkedIn Economic Graph Research Institute, The Triple Penalty (2026) | |
| #243 | Hiring & pay | US AI job postings roughly doubled between 2023 and 2026. | United States, 2023 to 2026 | LinkedIn Economic Graph Research Institute, The AI Talent Divide (2026) | |
| #244 | Hiring & pay | The typical US AI job posting listed approximately $177,000 in compensation, compared with $80,000 for the typical non-AI role. | United States, published August 2026 | LinkedIn Economic Graph Research Institute, The AI Talent Divide (2026) |
No data points match those filters. Try removing a filter or broadening your search.
What is still missing
Questions the current evidence cannot answer: partner with us
Employers, funders and policymakers are working without these numbers. Research Partners and Sponsors help us produce them.
- A current official US headcount for dedicated AI roles, disaggregated by gender and underrepresented groups
- Women in AI pay by role, level, geography and total compensation
- Promotion and attrition from entry-level AI work through director, VP and C-suite roles
- Representation on AI governance, safety and model-evaluation teams
- Patent inventorship and model-development leadership by gender
- AI startup funding by all-women, mixed and all-men teams, with deal count and median size
- Adoption and support data for underrepresented women
- Longitudinal evidence separating augmentation, job redesign and displacement
- Gender-disaggregated data on who builds, deploys and manages AI agents
WomenTech Network × Women AI Builders
Help close these gaps: join the State of Women in AI 2026 study
The State of Women in AI 2026 is an independent global study of how women build, lead and work with AI. Every response strengthens one of the world's largest independent studies on women in AI.
Take part in the study- ConfidentialResponses are reported only in aggregate; no individual answer is shared.
- About 10 minutesComplete the questionnaire in one focused sitting.
- Global research impactHelp inform the annual State of Women in AI report.
Go further
Next steps on WomenTech Network
Take part in the research, follow women leading AI, find AI and data roles, or join the global conference.
State of Women in AI 2026
Ten confidential minutes that feed the independent global study run by WomenTech Network and Women AI Builders.
Join the study → Voices & guidesWomen leading in artificial intelligence
Interviews, how-to guides and conference talks from women building, deploying and governing AI.
Open the AI topic hub → Hiring nowAI, data and tech roles
Open positions from employers recruiting for artificial intelligence, data and engineering teams.
Browse the jobs board → 18–21 May 2027 · virtual & in-personWomen in Tech Global Conference 2027
Chief in Tech Summit (May 18), AI & Key Tech Summit (May 19), Career & Growth Summit (May 20) and Startup & Innovation Summit (May 21), with women and allies from around the world.
See the conference → Nominations close October 1, 2026Women in Tech & AI Global Awards 2026
Celebrate the leaders, innovators and companies advancing women in tech and AI. Voting ends November 13; winners announced December 3, 2026.
Nominate yourself or your company → Broader industry benchmarksWomen in Tech Statistics 2026
Compare AI representation with workforce, leadership, pay, education and entrepreneurship data across the technology sector.
Explore Women in Tech statistics →Infographics
Take the key statistics with you
Every graphic below states its source. Download the WomenTech Network version, or the plain version that carries only a credit line, and use them in talks, articles and posts.
Download with the WomenTech Network logo · Download without logo (credit line)
Download with the WomenTech Network logo · Download without logo (credit line)
Download with the WomenTech Network logo · Download without logo (credit line)

Download with the WomenTech Network logo · Download without logo (credit line)
Download with the WomenTech Network logo · Download without logo (credit line)
Download with the WomenTech Network logo · Download without logo (credit line)
Download with the WomenTech Network logo · Download without logo (credit line)

Download with the WomenTech Network logo · Download without logo (credit line)
Download with the WomenTech Network logo · Download without logo (credit line)

Download with the WomenTech Network logo · Download without logo (credit line)

Download with the WomenTech Network logo · Download without logo (credit line)
Download with the WomenTech Network logo · Download without logo (credit line)
Download with the WomenTech Network logo · Download without logo (credit line)
Download with the WomenTech Network logo · Download without logo (credit line)
Download with the WomenTech Network logo · Download without logo (credit line)
Download with the WomenTech Network logo · Download without logo (credit line)
Download with the WomenTech Network logo · Download without logo (credit line)
Download with the WomenTech Network logo · Download without logo (credit line)
Download with the WomenTech Network logo · Download without logo (credit line)
Quick answers
Women in AI: frequently asked questions
Short, sourced answers to the questions readers ask most about women in AI roles, adoption, jobs and funding.
What percentage of AI roles are held by women?
In the United States, women made up 34.3% of LinkedIn AI talent in 2025 (Stanford AI Index Report 2026). The most recent global LinkedIn measure is 30.54%, for 2024.
What does the 34.3% women-in-AI figure measure?
It is the share of US LinkedIn members whose profiles mark them as AI talent who are women. The data are 2025 LinkedIn Economic Graph figures published in the Stanford AI Index Report 2026.
What do the approximately 30% estimates represent?
They describe broad AI talent or workforce populations rather than specific job titles: Stanford put women at 30.54% of global LinkedIn AI talent in 2024, and the ILO reported in 2026 that women were about 30% of the global AI workforce in 2022.
What percentage of the US AI workforce is women?
The latest figure is 34.3% of US LinkedIn AI talent in 2025, from Stanford’s 2026 report. An earlier occupation-and-skills study cited by the OECD put women at 36% of the US AI workforce.
Are women using AI less than men?
Slightly, and it depends on the measure. In 2026, 47% of US women and 50% of men had used an AI chatbot; daily use was 20% versus 27%. For professional GenAI use in 2025, Brookings and NORC found 17% of women against 25% of men.
Which AI chatbot has gender parity in use?
ChatGPT: Pew found identical adoption among US women and men in 2026, 44% each. Men reported more use of Gemini, Copilot, Grok and Claude; women were slightly more likely to use chatbots for emotional support or advice, 11% versus 8%.
Are women’s jobs more exposed to generative AI?
On current occupational-exposure measures, yes. Brookings found 36% of US women workers, against 25% of men, in occupations where GenAI could save at least half the time on tasks; the ILO measured 29% exposure in female-dominated occupations and 16% in male-dominated ones.
Does AI exposure mean women will lose their jobs?
Not by itself. Exposure means AI can take on tasks; whether a role is automated, augmented or redesigned is an employer decision, and access to reskilling decides who benefits from the change.
How many AI researchers are women?
UNESCO estimates women at 12% of AI researchers globally; in the United States, women earned 17.3% of AI research doctorates in 2024 (NSF).
How many AI executives are women?
LinkedIn reported in August 2026 that women held 13% of C-suite AI roles at AI companies across 27 countries. IMD’s broader 2026 estimate puts women in 14% of AI executive roles worldwide; the two measures count different populations and should not be swapped.
Is the women-in-AI skills gap closing?
On learning platforms it is narrowing: women’s share of Coursera GenAI enrollments rose from 32% in 2024 to 36% in 2025, and from 36% to 42% among enterprise learners. Advanced research lags: women earned 17.3% of US AI research doctorates in 2024 (NSF).
How much funding goes to women-founded AI companies?
PitchBook reported that US companies with at least one woman founder raised $73.6 billion in 2025, roughly two-thirds of it in AI. Scale AI and Anthropic alone account for more than $30 billion, so the total is highly concentrated.
Why do women-in-AI statistics differ?
Because they measure different populations, years and geographies. LinkedIn talent counts, occupational models, research databases and consumer surveys each answer a different question about women in AI.
What share of AI hires are women?
One in four: women were 26% of US AI hires in 2025, against 50% of non-AI hires (LinkedIn Economic Graph Research Institute, 2026). By role, women were 20% of Head of AI hires, 26% of Director of AI hires and 18% of Member of Technical Staff hires.
How many AI PhDs are earned by women?
17.3% of US artificial intelligence research doctorates went to women in 2024, 51 of 295 recipients (NSF Survey of Earned Doctorates). New computing faculty hires were 30.2% women in 2021, up from 24.9% in 2017.
Is there an AI gender pay gap?
The LinkedIn report does not compare women and men within the same AI job. It found typical listed compensation of $177,000 for a US AI job and $80,000 for a non-AI job; across AI occupations, a 10 percentage-point rise in the male share went with about $45,000 higher median listed pay, a cross-occupation pattern rather than proof of pay discrimination within a role. Jobs professionalised by AI also carry 42% higher wage growth since 2021 (PwC 2026 AI Jobs Barometer).
In which countries do women hold the largest share of AI talent?
Romania (42.04%), Singapore (38.01%) and South Africa (37.31%) lead the 41 countries in the Stanford AI Index 2026 (2025 LinkedIn data). The United States is at 34.26%, India 30.64%, the United Kingdom 30.25%, Germany 25.08% and Brazil, the lowest, 23.41%.
How did women AI founders fare in 2025?
In the United States, companies with at least one woman founder raised a record $73.6 billion, 27.7% of VC deal value, two-thirds of it in AI, and reached 25% of exit count (PitchBook). In Europe, their share of deal activity trended down. PitchBook also tracks funding by founder mix (all-women, mixed-gender, all-men), reported separately from the at-least-one-woman-founder measure.
Is there data on women and agentic AI?
Almost none. The big enterprise surveys measure agent adoption without a gender split, for example 88% of senior executives raising AI budgets for agentic AI (PwC, 2025) and 81% of leaders expecting agents in their AI strategy within 12 to 18 months (Microsoft, 2025). The only gender-disaggregated figure so far comes from Anthropic’s 2026 survey of social scientists, in which typically male names had adopted coding agents at more than twice the rate of typically female names. The State of Women in AI 2026 study is designed to fill exactly this gap.
How this page was built
Sources, definitions and corrections
Every figure links to its origin and states its population, geography and year.
Where the data come from
Official statistics, multilateral institutions, major research organizations, nationally representative surveys and industry datasets with transparent methods.
What each number counts
Population, geography and year are stated for every finding, and measures of roles, talent, research, leadership and adoption are never merged.
Corrections
Spotted an update or an error? Email the data-point number and source to [email protected].
Attribution
How to cite these statistics
Credit the original source for any single figure and WomenTech Network for this compilation.
State of Women in AI 2026
Your experience belongs in next year’s numbers
If AI touches your work, career or industry, the study needs your answers. It is confidential, global, free and takes about 10 minutes.
Join the study